Trace based alerts
A Trace-based alert in SigNoz allows you to define conditions based on trace data, triggering alerts when these conditions are met. Here's a breakdown of the various sections and options available when configuring a Trace-based alert:
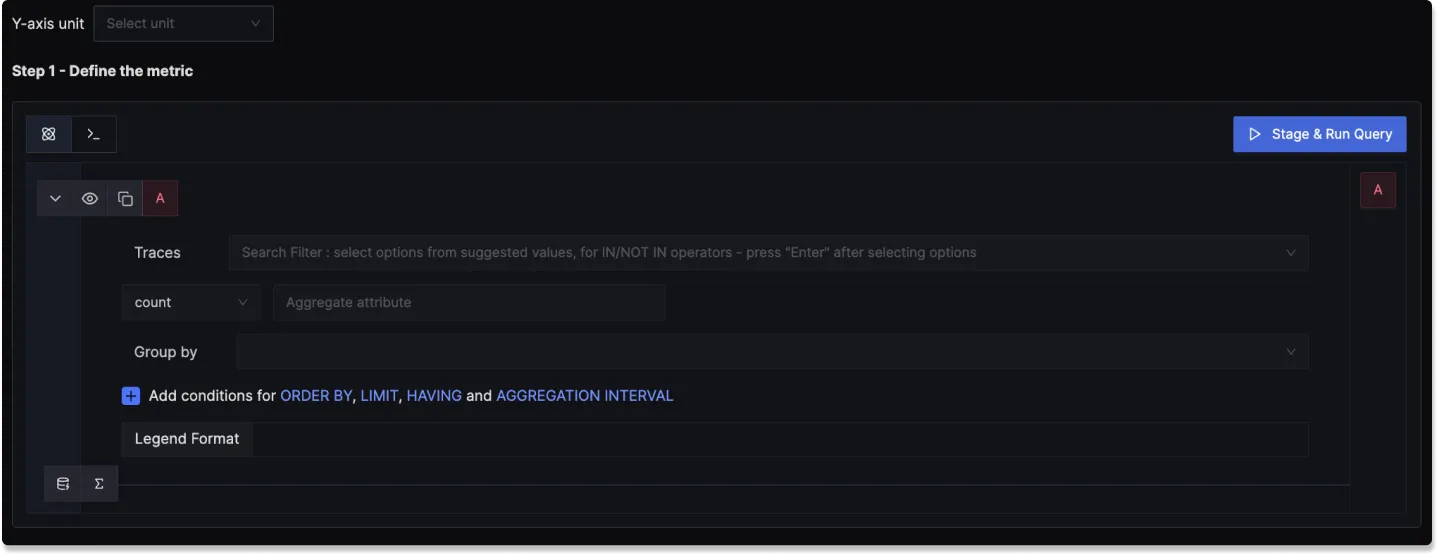
Step 1: Define the Trace Metric
In this step, you use the Traces Query Builder to perform operations on your Traces to define conditions based on traces data. Some of the fields that are available in Traces Query Builder includes
Traces: A field to filter the trace data to monitor.
Aggregate Attribute: Allows you to choose how the trace data should be aggregated. You can use functions like "Count."
Group by: Lets you group trace data by different attributes, like "serviceName," "Status," or other custom attributes.
Legend Format: An optional field to define the format for the legend in the visual representation of the alert.
Having: Apply conditions to filter the results further based on aggregate value.
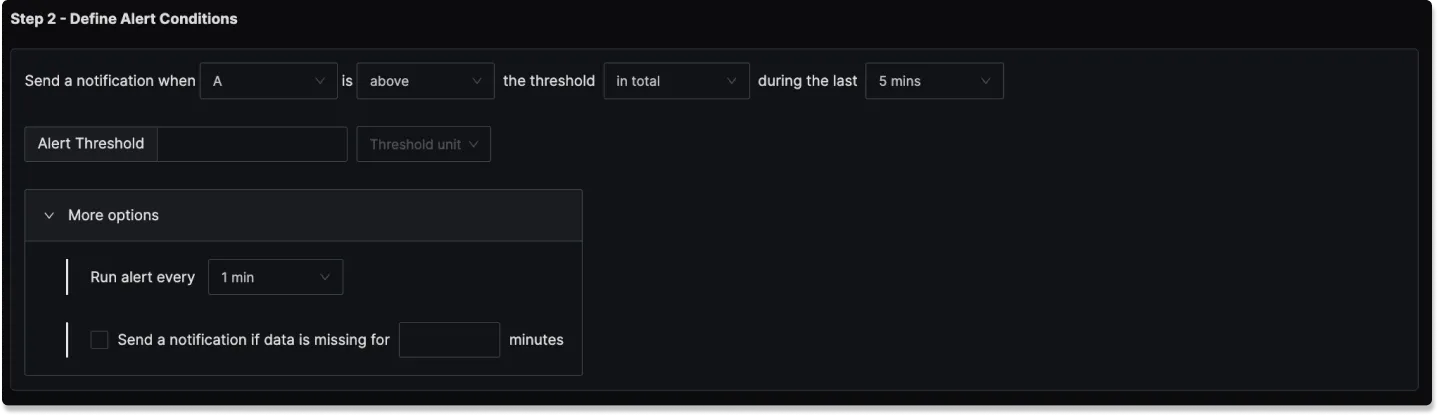
Step 2: Define Alert Conditions
In this step, you set specific conditions for triggering the alert and determine the frequency of checking these conditions:
Send a notification when [A] is [above/below] the threshold in total during the last [X] mins: A template to set the threshold for the alert, allowing you to define when the alert condition should be checked.
Alert Threshold: A field to specify the threshold value for the alert condition.
More Options :
Run alert every [X mins]: This option determines the frequency at which the alert condition is checked and notifications are sent.
Send a notification if data is missing for [X] mins: A field to specify if a notification should be sent when data is missing for a certain period.
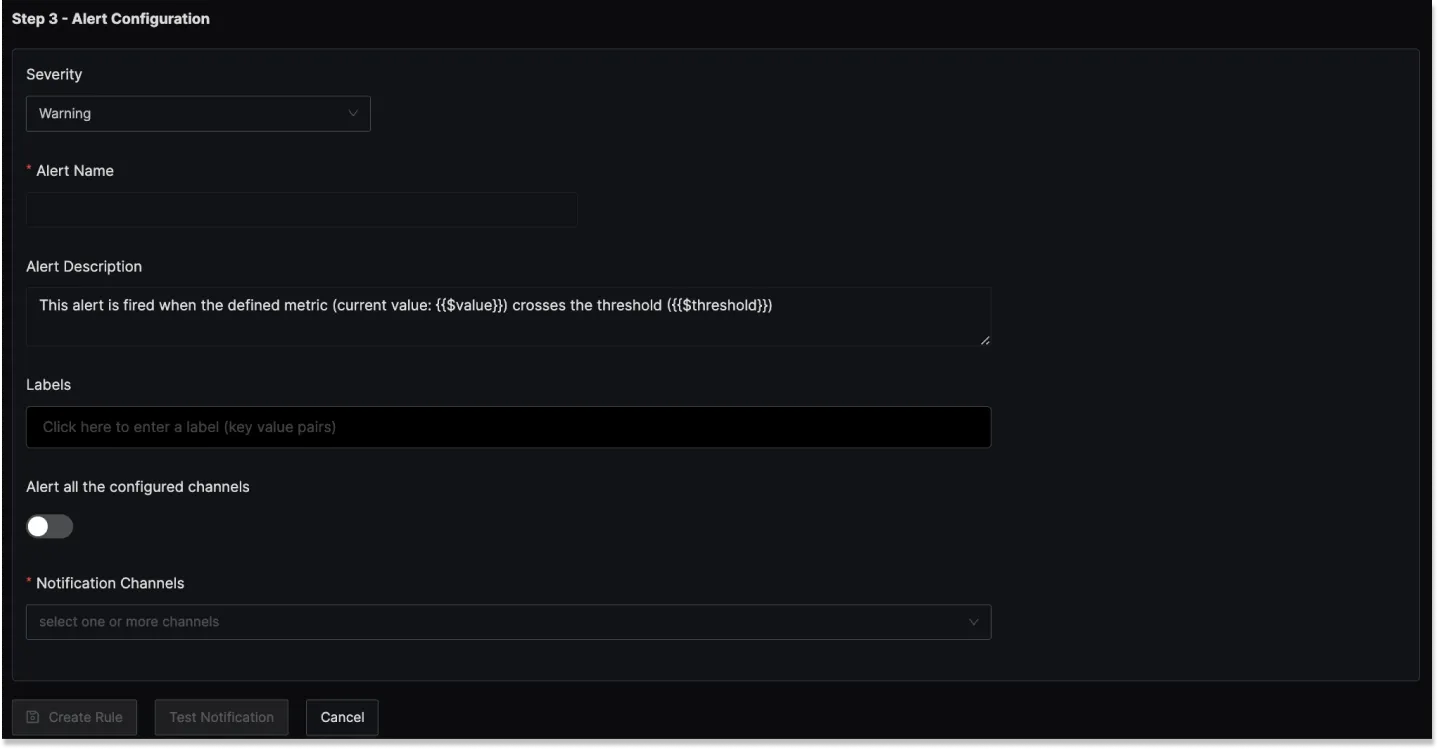
Step 3: Alert Configuration
This step is for setting the alert's severity, name, and other descriptive details:
Severity: Set the severity level for the alert, like "Warning" or "Critical."
Alert Name: A field to name the alert for easy identification.
Alert Description: Add a detailed description for the alert, explaining its purpose and trigger conditions.
Labels: A field to add tags or labels for easier categorization.
Notification channels: A field to choose the notification channels from those configured in the Alert Channel settings.
Test Notification: A button to test the alert to ensure that it works as expected.
Result labels in alert description
You can incorporate result labels in the alert descriptions to make the alerts more informative:
Syntax: Use {{.Labels.<label-name>}} to insert label values.
Example: If you have a query that returns the label service_name then to use it in the alert description, you will use {{.Labels.service_name}}which creates an alert that is specific to the particular service.
Example
An example Trace-based alert could be set to trigger when a specific operation exceeds a latency threshold:
- Y-axis unit: "nanoseconds(ns)"
- Aggregate attribute: "durationNano"
- Group by: "serviceName"
- Alert Threshold: "200 milliseconds(ms)"
- Run alert every: 1 minute
- Send a notification if data is missing for 5 minutes
- Alert Name: "High Latency Alert"
- Severity: "Warning"
- Notification Channels: signoz-slack-alerts (Slack channel)