Metrics based alerts
A Metric-based alert in SigNoz allows you to define conditions based on metric data and trigger alerts when these conditions are met. Here's a breakdown of the various sections and options available when configuring a Metric-based alert:
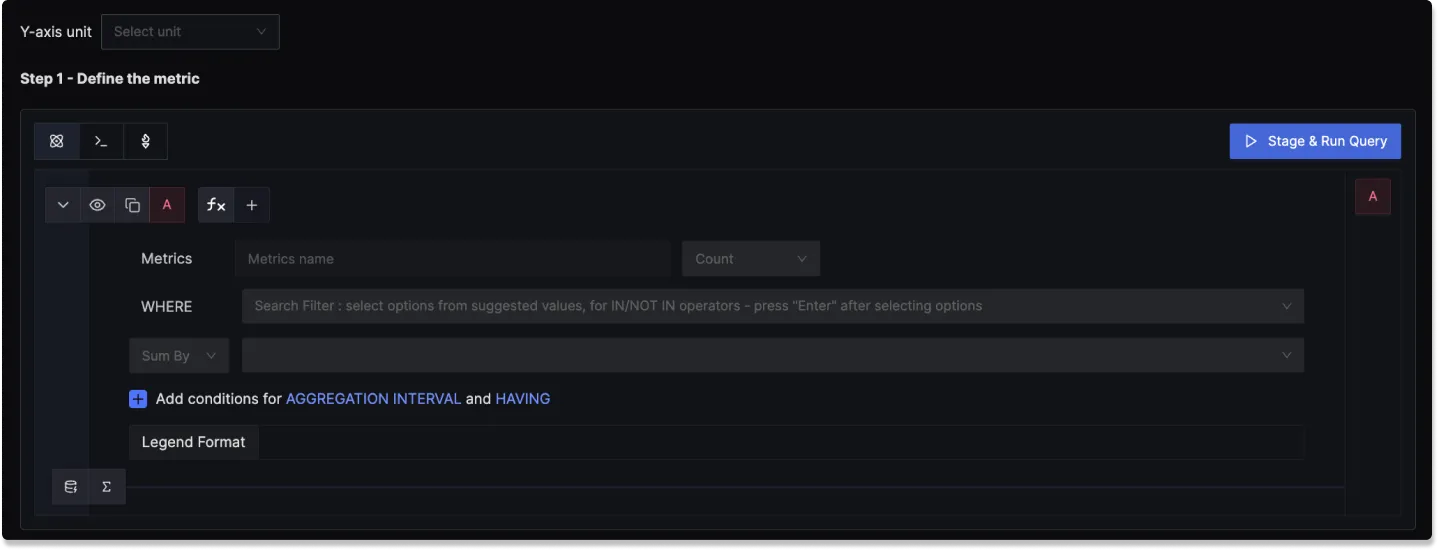
Step 1: Define the Metric
In this step, you use the Metrics Query Builder to choose the metric to monitor. Some of the fields that are available in Metrics Query Builder includes:
Metrics: A field to select the specific metric you want to monitor (e.g., CPU usage, memory utilization). You can also choose an aggregation function like "Count," "Sum," or "Average."
WHERE: A filter field to define specific conditions for the metric. You can apply logical operators like "IN," "NOT IN".
Legend Format: An optional field to customize the legend's format in the visual representation of the alert.
Having: Apply conditions to filter the results further based on aggregate value.
To know more about the functionalities of the Query Builder, checkout the documentation.
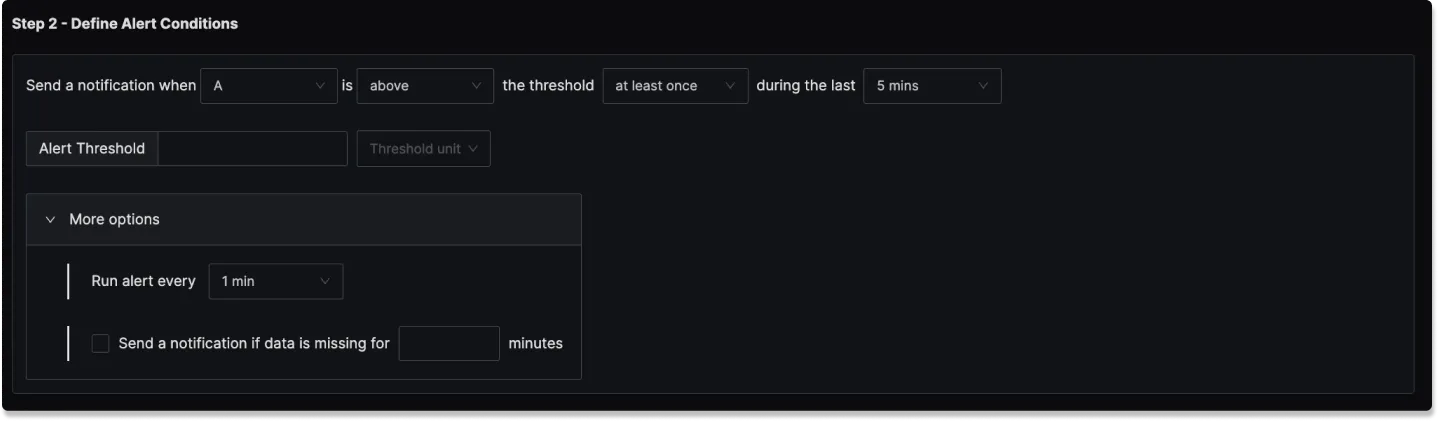
Step 2: Define Alert Conditions
In this step, you define the specific conditions that trigger the alert and the notification frequency. The following fields are available:
Send a notification when [A] is [above/below] the threshold at least once during the last [X] mins: A condition template to set the threshold for the alert, with options to define when and how often the condition should be checked.
Alert Threshold: A field to set the threshold for the alert condition.
More Options :
Run alert every [X mins]: This option determines the frequency at which the alert condition is checked and notifications are sent.
Send a notification if data is missing for [X] mins: A field to specify if a notification should be sent when data is missing for a certain period.
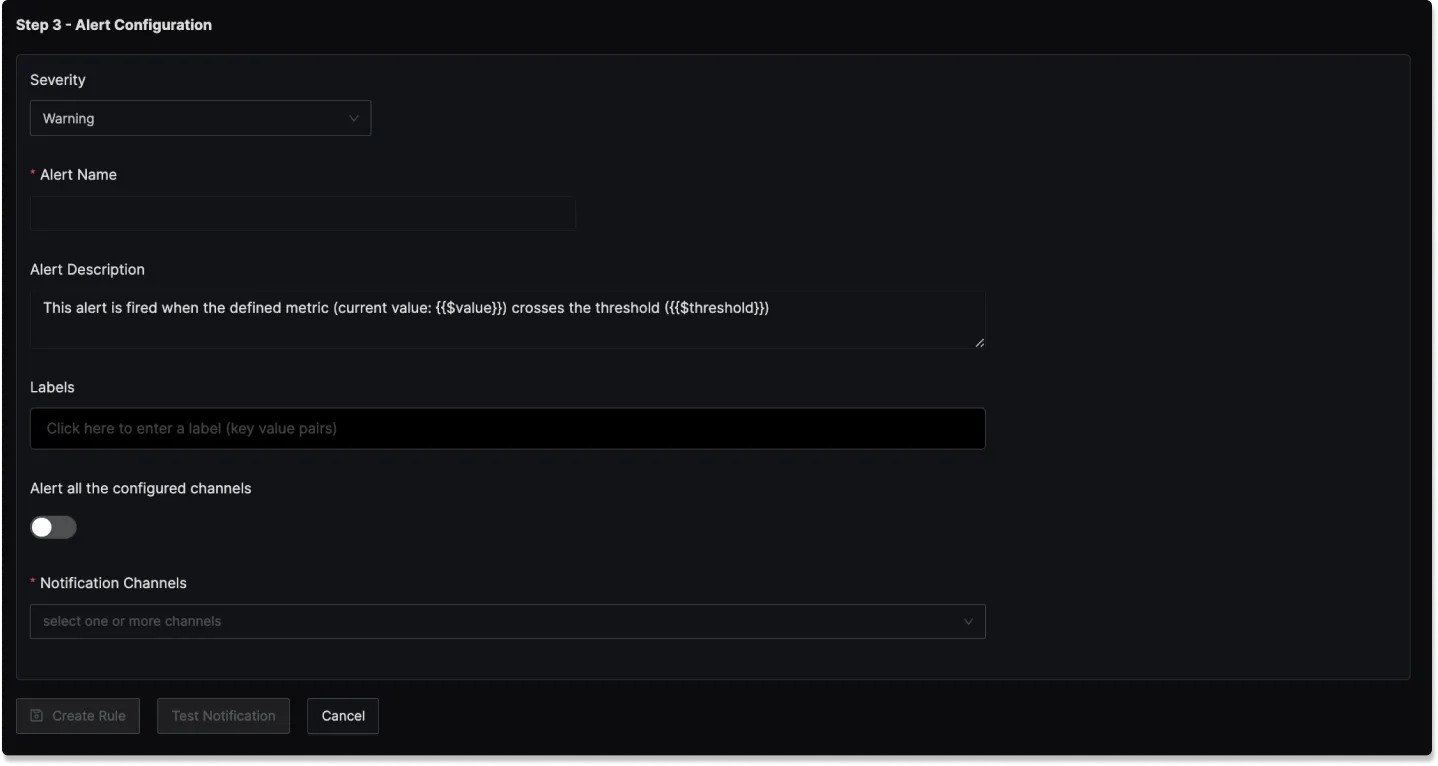
Step 3: Alert Configuration
This step focuses on setting alert properties like severity, description, and other metadata. The following fields are available:
Severity: Set the severity level for the alert (e.g., "Warning", "Critical" etc.).
Alert Name: A field to name the alert for easy identification.
Alert Description: A field for adding a detailed description of the alert, explaining what it monitors and under what conditions it is triggered.
Labels: A field to add labels or tags to the alert for categorization.
Notification channels: A field to choose the notification channels from those configured in the Alert Channel settings.
Test Notification: A button to test the alert to ensure that it works as expected.
Result labels in alert description
You can incorporate result labels in the alert descriptions to make the alerts more informative:
Syntax: Use {{.Labels.<label-name>}} to insert label values.
Example: If you have a query that returns the label service_name then to use it in the alert description, you will use {{.Labels.service_name}}which creates an alert that is specific to the particular service.
Example
An example Metrics-based alert could be set to trigger when errors go above a certain percentage:
- Y-axis unit: Percent(0 - 100)
- Query A: Total Calls with Error
- Query B: Total Calls
- Function: A*100/B
- Alert Threshold: Above 0 within 5 minutes
- Run alert every: 1 minute
- Send a notification if data is missing for 5 minutes
- Severity: "Critical"
- Alert Name: "Error Percentage Alert"
- Alert Description: "This alert triggers when the Error percentage > 5%."
- label:
error percentage - Notification Channels: signoz-slack-alerts (Slack channel)