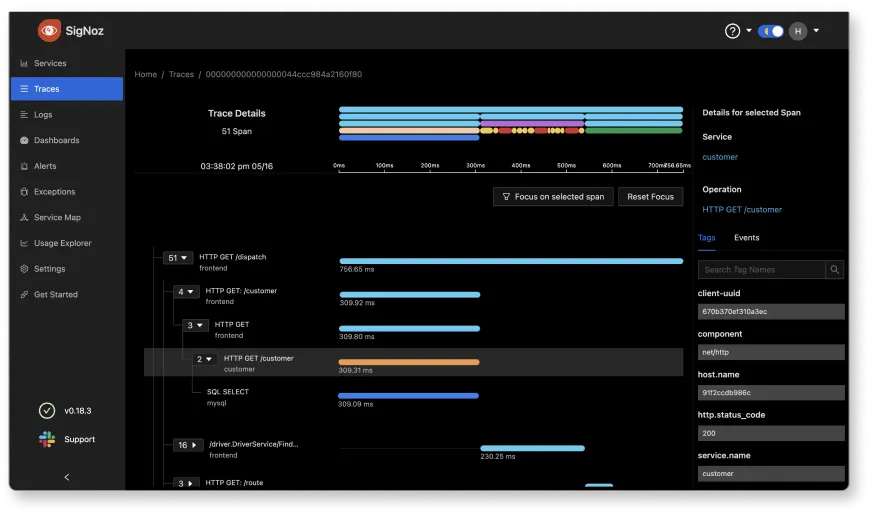
In-Depth: SigNoz vs Grafana
Under the hood, Grafana is powered by multiple tools like Loki, Tempo, Mimir & Prometheus. SigNoz is built as a single tool to serve logs, metrics, and traces in a single pane of glass from Day 1.
Key Points: SigNoz vs Grafana
Why do devs choose SigNoz over Grafana?
SigNoz is loved by developers. With over 14k+ Github stars, 100+ contributors, and 20k+ community members, it’s one of the top open source projects in the observability domain. Many of our users have switched from Grafana.
Here are a few reasons why.
1. SigNoz is built as a single application to serve logs, metrics, and traces.
Grafana started as a data visualization tool. It slowly evolved into a tool that can take data from multiple data sources for visualization.
For observability, Grafana offers the LGTM stack (Loki for logs, Grafana for visualization, Tempo for traces, and Mimir for metrics). You need to configure and maintain multiple configurations for a full-stack observability setup.
SigNoz is a single application that provides logs, metrics and traces under a single pane of glass. Ingestion, storage, and querying of signals are optimized for ease of use and intelligent out-of-box correlation between the three signals. There is less operational overhead and better developer experience with SigNoz.
2. SigNoz is OpenTelemetry-native
OpenTelemetry is the second most active project in the CNCF, with only Kubernetes being more active. Using an open source standard like OpenTelemetry for generating telemetry signals frees you from vendor lock-in. SigNoz is built to support OpenTelemetry from Day 1.
We provide features like application exceptions to traces from OTel data for fast debugging. Grafana also supports OpenTelemetry. But it uses different backends for different signals - Loki for logs and Tempo for traces.
3. SigNoz uses columnar database for faster ingestion & aggregation
SigNoz uses ClickHouse - a fast open source distributed columnar database. Ingestion and aggregations are lightning-fast while providing best-in-class compression for economical storage. It was built to do analytical queries like Group By fast. Read more on what makes ClickHouse so fast.
4. Loki was not built to index and query high-cardinality data
Loki doesn’t perform well if you want to index and query high-cardinality data.
“As a Loki user or operator, your goal should be to use the fewest labels possible to store your logs. (Source: Grafana)”
We did a logs performance benchmark of SigNoz with Elasticsearch and Loki. Below are our key findings for Loki for ingestion, querying, and storage:
- Ingestion is mostly limited by the number of streams that it can handle.
- For our test queries, Loki was not able to return the results.
- Loki took the least amount of storage as it indexed only two keys.
SigNoz is able to perform fast aggregation queries and also has efficient resource utilization during ingestion.
5. SigNoz is much easier to self-host
Side by Side Comparison
Open Source
Logs, Metrics, Traces
APM
Alerts
Single Backend
OpenTelemetry visualization
No user-based pricing
Exceptions Monitoring
Synthetic Monitoring
Incident Response
Easy self-host
Analytics on high cardinality data
SigNoz is also better value for money.
We did a pricing comparsion of SigNoz with other popularity observability tools including Grafana. SigNoz can save up to 45% of your Grafana bill.
Read our pricing comparison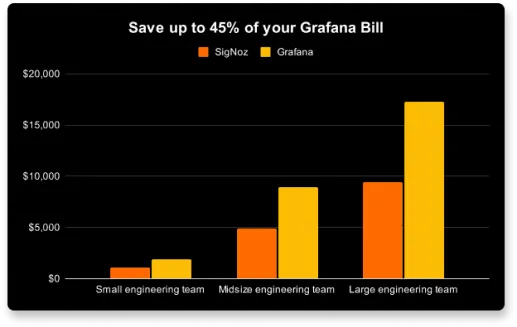
Trusted by teams at


OpenTelemetry-Native Metrics, Logs, and Traces in a single pane of glass
SigNoz Cloud is the easiest way to run SigNoz
Try SigNoz CloudStill undecided? Let us help.
If you have concerns about whether SigNoz is a good fit or not, let us chat. Write to us with your queries and we will get back to you.