Query Builder
Introduction
Query Builder in SigNoz simplifies the process of filtering, aggregating, and visualizing data, making complex queries accessible to all users. This documentation will walk you through features of the Query Builder, showing you how to create detailed queries, visualize results, and understand your data better.
Logs and Traces Query Builder
Filtering
The Query Builder in SigNoz allows users to apply filtering based on various attributes of logs or traces.
Using the Filtering Feature
- Access: Navigate to the Query Builder.
- Open Filter Options: Click on the Search Filter field to open a dropdown list of available attributes.
- Select Attributes: Choose the attribute you want to filter by (e.g.,
service.name,level,status). - Apply Operators: Choose the operator (e.g.,
=,!=,IN,NOT_IN) for the selected attribute. - Input Values: Input the value(s) you want to filter by.
- Combine Filters: You can add multiple filters by repeating the above steps.
- View Results: Click the Stage & Run Query Button to display the logs or traces that match the applied filters.
Example
Suppose you want to filter logs from a specific service with a particular severity level. You can achieve this using the following filters:
- selecting the service name.
service.name = demo-app - selecting the severity text,
severity_text = DEBUG
Aggregation and Grouping
The Query Builder's Aggregation and Grouping feature enables you to combine data points and categorize them for complex insights.
Aggregation
Aggregation allows you to perform calculations on a set of values to return a single value. With the Query Builder, you can:
- Count: Count the number of times a particular event occurs.
- Count Distinct: Count unique occurrences of a specified attribute.
- Sum: Calculate the total for a numerical attribute.
- Avg: Find the average value of a numerical attribute.
- Max/Min: Determine the maximum or minimum value of a numerical attribute in an aggregation interval.
- Percentiles (P05, P10, P90, etc.): Understand the distribution of your data with percentile calculations.
- Rate: Measure the frequency of occurrence within a given time frame.
- Rate Sum: Total the aggregated values over the specified rate period.
- Rate Avg: Find the average rate over the period.
- Rate Min/Max: Determine the minimum or maximum rate observed in the selected period.
Grouping
Grouping allows you to segment your data based on chosen attributes, facilitating comparative analysis across different categories of the selected attributes:
- You can group data by attributes like
service.nameormethodto analyze patterns per service or HTTP method. - When combined with aggregation, grouping enables you to, for example, find the average response time per service or count errors per endpoint.
Using Aggregation and Grouping Together
- Select an aggregation function from the dropdown, such as
Avg. - Then, choose an attribute to apply it to, like
response_time. - To group the data, you would then specify an attribute in the
Group byfield. - After running the query, you'll see the average response times for each group, allowing you to identify areas that may need optimization.
Example
To analyze the average response time of services within a system, we can do so in the following way:
- In the aggregation dropdown, select
Avg. - For the attribute to aggregate, choose
durationNano. - To see the average duration for each of the service, enter
serviceNamein theGroup byfield.
Result Manipulation
Result Manipulation is a set of features in the Query Builder that enables you to refine your query. The features include:
Order By
Order your query results based on a specified attribute in either ascending or descending order. This can help in identifying the highest or lowest values in your data, such as the most frequently occurring errors.
Aggregate Every
Define the interval over which to aggregate data. For example, you can aggregate count data in 60-second intervals to get a per-minute count of events. For now it is not editable in the Query Builder and it changes dynamically based on time period of query.
Limit
Set a limit on the number of results returned. This is useful when you only want to see the top N results, such as the top 10 most visited endpoints.
Having
Apply conditions to filter the results further based on aggregate value.
Legend Format
Customize the legend in your query's visual output to give more clarity, by formatting how grouped data will be labeled in your charts or graphs. We use the double
curly braces - {{}} format to show the attribute.
For example, if you have grouped by serviceName attribute then you can write {{serviceName}} in your legend. You can also add text along with the attribute like {{serviceName}} - This is a service will show be shown as sampleService - This is a service name.
Example
Suppose you want to find the top 2 endpoints with an average response time greater than 500 ms. The query is configured as follows:
- Group by:
httpUrl - Aggregate:
AvgondurationNano - HAVING:
AVG(durationNano) >= 500000000to filter for endpoints with average response times exceeding 500 ms - Order by:
avg(durationNano) descto list endpoints with the highest response times first - Limit:
2to focus on the top 2 endpoints with the longest response times - Legend Format:
{{httpUrl}}to display the endpoint's URL in the visualization legend
Multiple Queries and Functions
The SigNoz Query Builder allows you to run multiple queries simultaneously and perform functions on them. This feature facilitates analysis of complex data, such as comparing data or calculating ratios.
Multiple Queries
Create and run multiple independent queries within the same view. Each query can have its own set of filters, aggregations, and groupings. This is particularly useful for analyzing different dimensions of your data in parallel.
Functions on Queries
Apply mathematical functions to the results of your queries. This allows you to derive new insights by performing operations like addition, subtraction, multiplication, division, or more complex functions on your data.
List of supported functions
- exp
- log
- ln
- exp2
- log2
- exp10
- log10
- sqrt
- cbrt
- erf
- erfc
- lgamma
- tgamma
- sin
- cos
- tan
- asin
- acos
- atan
- degrees
- radians
- now
- toUnixTimestamp
Example
Suppose you want to determiner the percentage of logs that contains errors relative to the total log count. You can achieve this using Multiple queries and a function as follows:
- Query A: Filters logs to count the instances where the
bodycontains the worderror. - Query B: Represents a baseline count of all logs.
- function
F1A**100/B
Metrics Query Builder
SigNoz's Metrics Query Builder has all the features mentioned above like filtering, aggregation, Order by, Multiple Queries etc. but it also has some additional functionalities which can enable users to delve deeper into metrics analysis with ease.
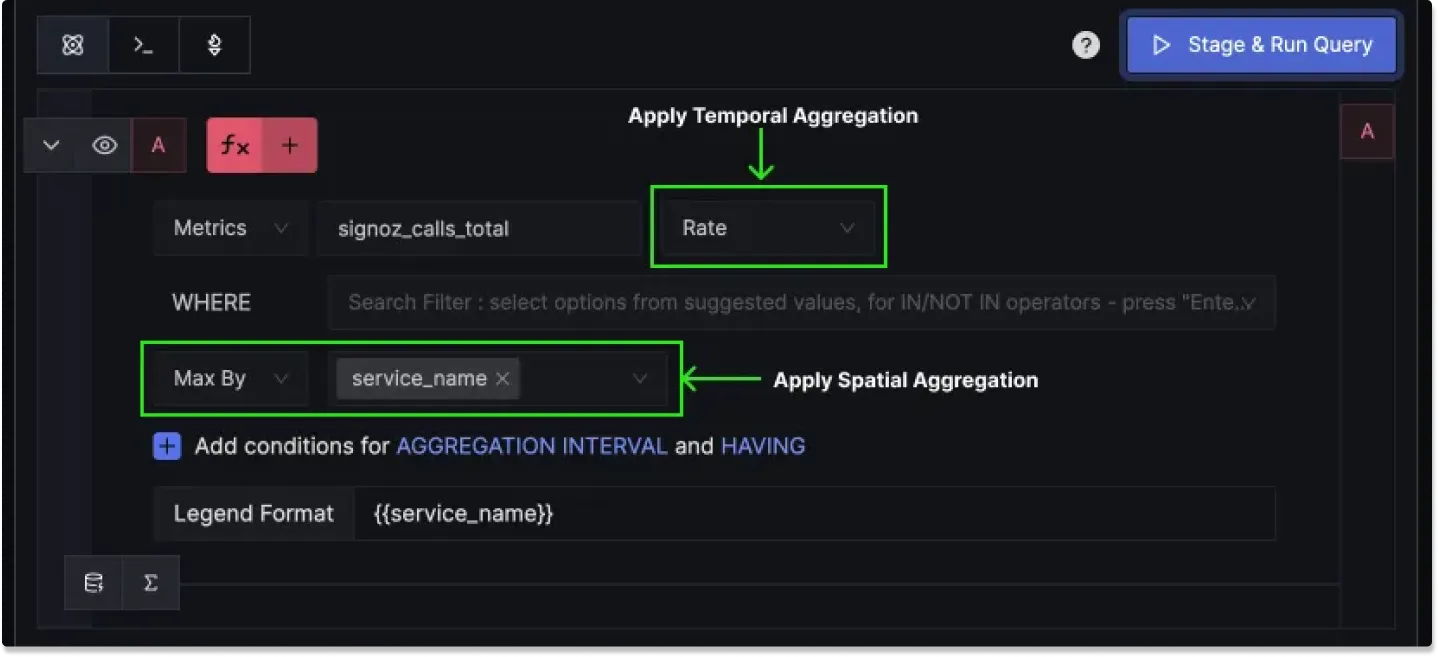
Spatial and Temporal Aggregations
Efficiently aggregate metrics data across time and various dimensions to gain comprehensive insights into your system's performance.
Temporal Aggregation
Temporal aggregation simplifies metric analysis by consolidating data points over specific time periods. It's essential for managing data from applications that transmit metrics at regular intervals, helping to reduce the volume of data points into a more interpretable format. This aggregation is particularly crucial when dealing with long-term data visualization, where displaying each data point is neither practical nor informative due to limited screen space.
Spatial Aggregation
Modern applications will have many time series across dimensions such as container names, service names, etc.
While temporal aggregations are meant for reducing data points across a single time axis, spatial aggregation refers to the technique of merging metric data across various dimensions or labels, such as container names, service names, or geographical regions.
Example
If you select a counter metric called signoz_calls_total, you can apply temporal aggregations like Rate and Increase on it. Similarly, you can apply spatial aggregations across many dimensions, such as service_name, operation, deployment_environment, etc.
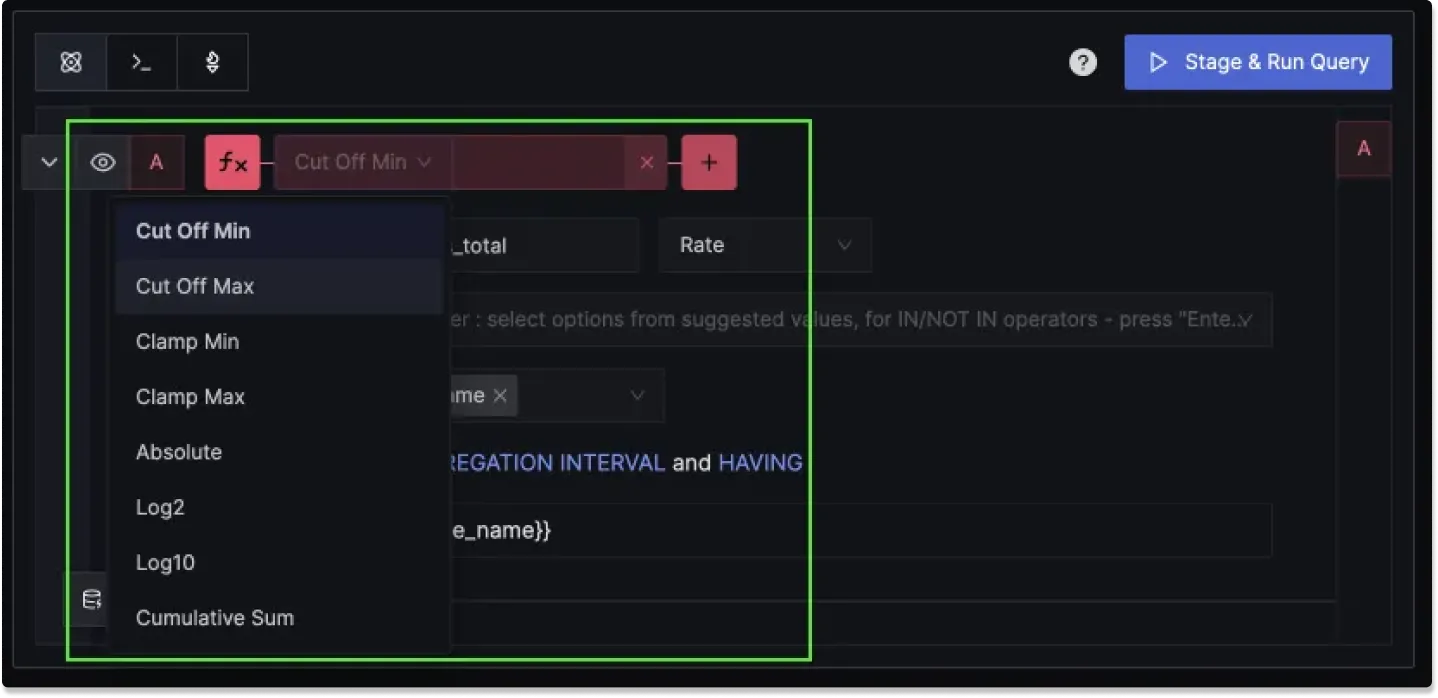
Functions for Extended Data Analysis
To extend the data analysis capabilities of the Metrics Query Builder, you can use four different categories of functions.
Function Types:
Exclusion Functions: These allow users to exclude data points based on certain conditions, such as values falling outside a specified range. This helps in focusing on the most relevant data. For example,
Cut Off Minexcludes data below a threshold, whileCut Off Maxignores values above a certain point.Arithmetic Functions: Users can perform mathematical operations on data points, enabling the customization of metric calculations to suit specific analysis needs. For example, functions like
Absolutecan return the absolute value of data points, and logarithmic functions such asLog2orLog10can transform data to a log scale for better comparison of wide-ranging numbers.Smoothing Functions: To deal with volatile data, smoothing functions can be applied, such as moving averages, which help in identifying underlying trends by reducing noise. For example, functions like EWMA 3/5/7 (Exponentially Weighted Moving Average) can smooth data fluctuations over 3, 5, or 7 periods.
Time Shift Functions: These functions enable comparisons of data across different time periods, useful for analyzing trends, changes, or anomalies over time. For example, using the
Time Shiftfunction for shifting a series by a fixed amount of seconds to compare current data with past data.
Chain Functions:
Combine two or more functions, like applying a logarithmic scale after setting a minimum cutoff, to tailor your metrics.
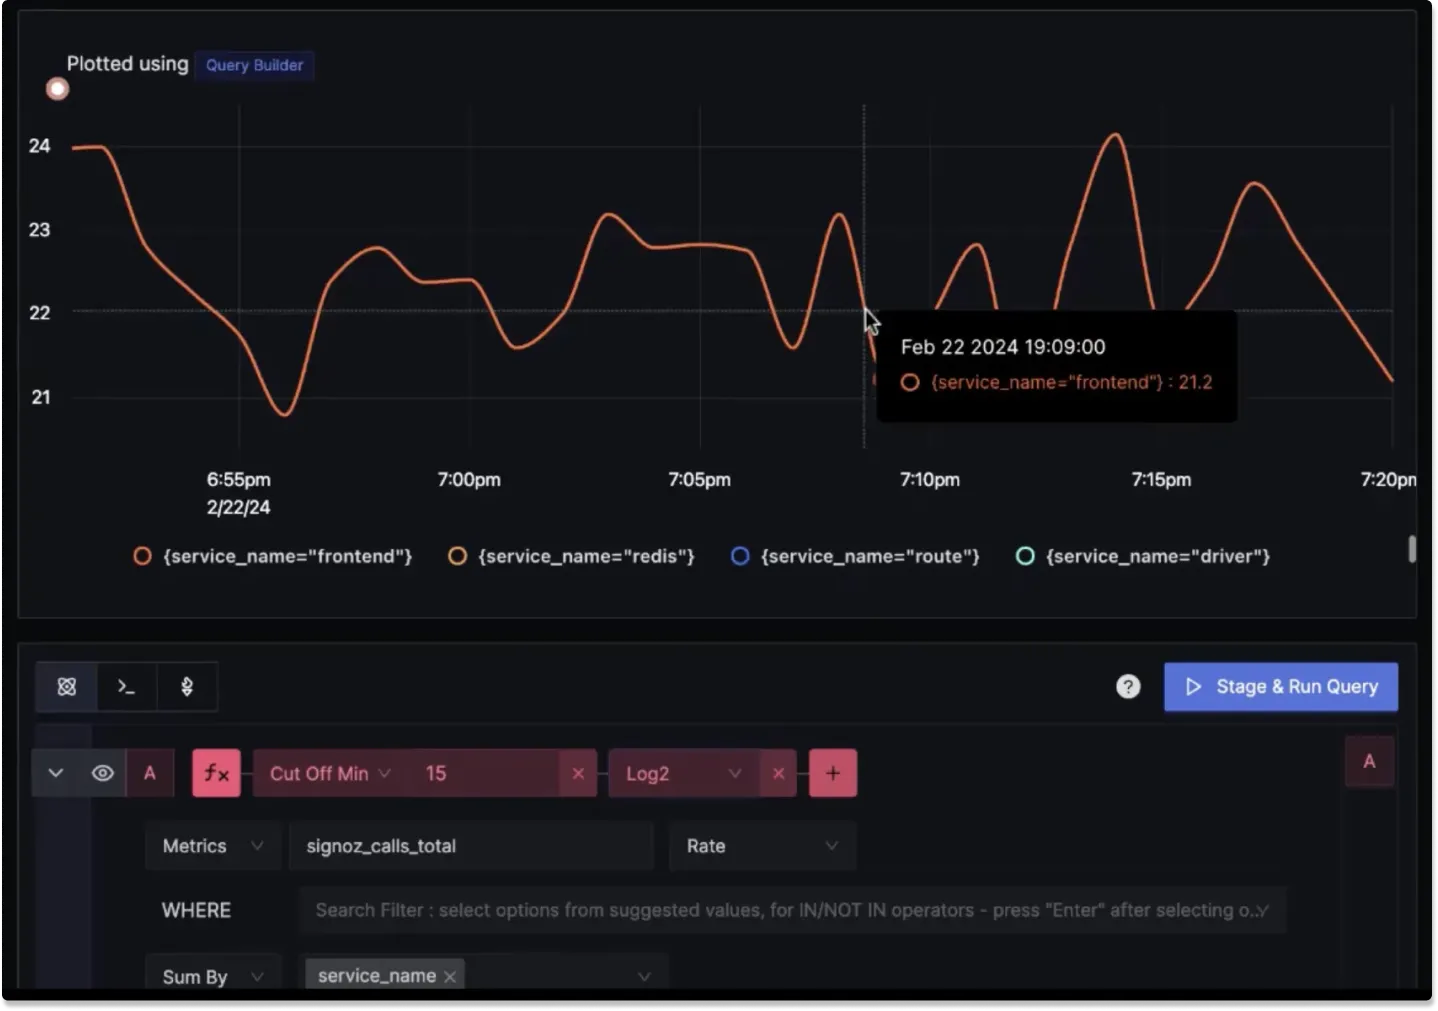
Example
This example uses the Time Shift function to compare total calls for frontend service in an interval of 1hr.
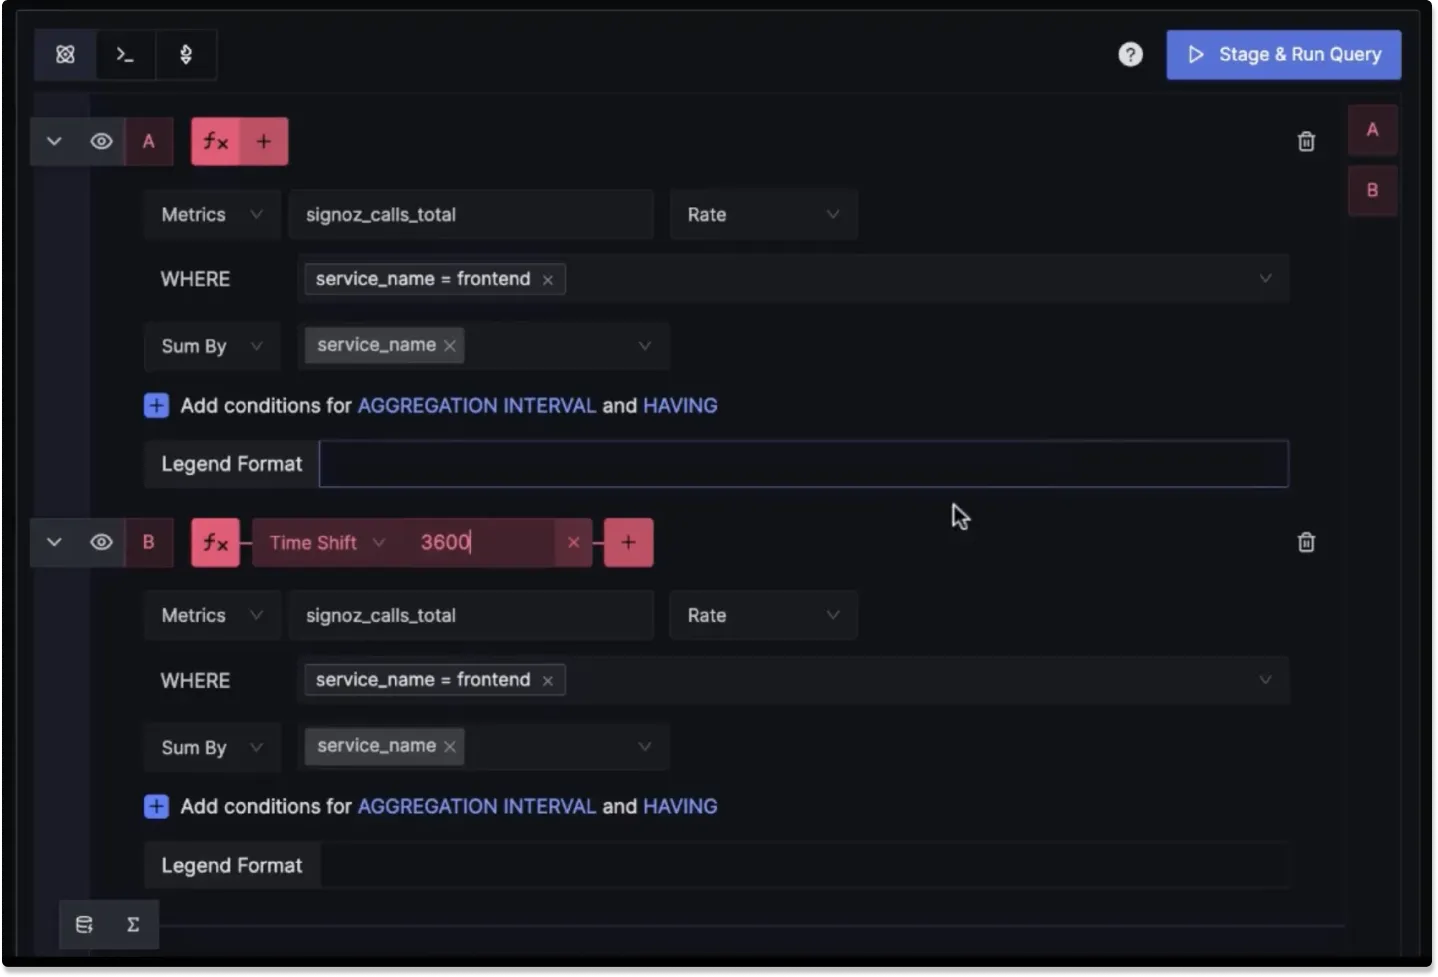
You can plot charts for the same service an hour apart.
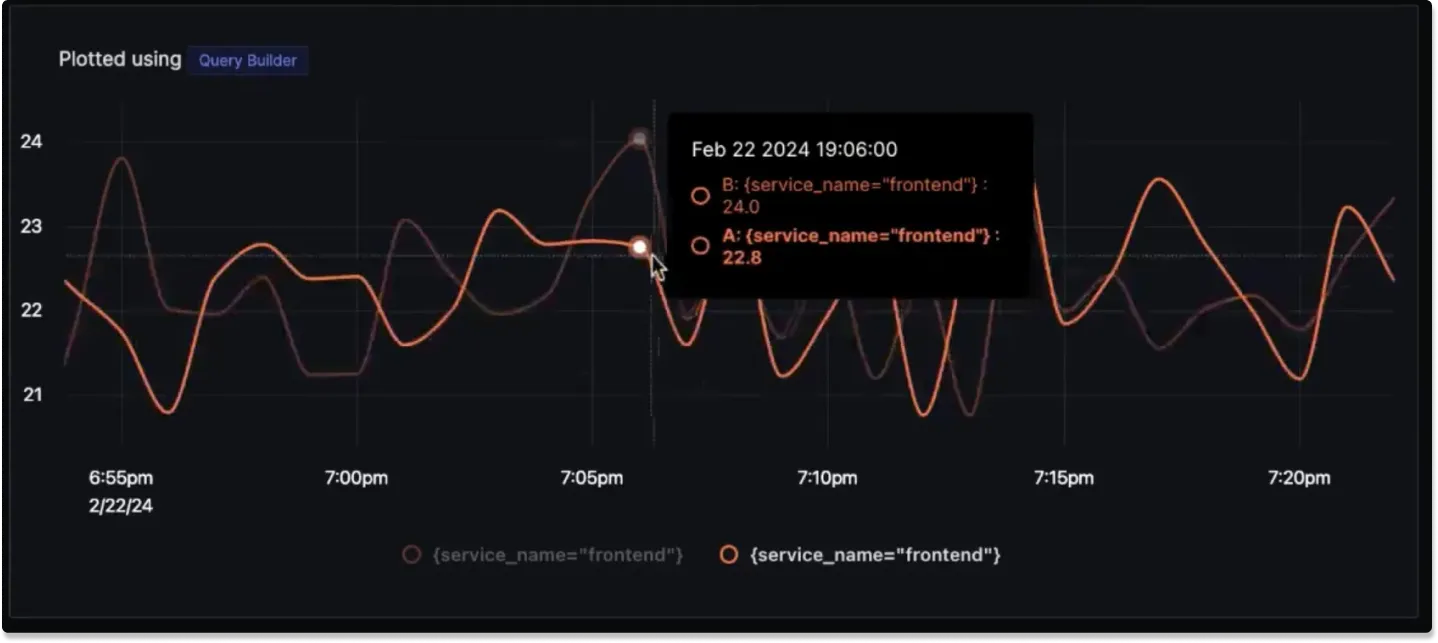
Users can use the time shift function for very practical use cases, like comparing performance metrics before and after a deployment.
To know more details about the Metrics Query Builder, you can checkout these resources from the first SigNoz Launch Week: