TL;DR:
- Datadog’s pricing is complex and unpredictable, leading to massive "bill shock."
- We built SigNoz as a cost-effective alternative that cuts observability bills by up to 80%.
- We’re passing savings to you by not charging per-host or per-user fees and not charging separate "indexing" fees.
- You get the same unified platform (metrics, traces, logs) but built on OpenTelemetry, so you're never locked in.
Datadog is often considered a leader in the observability space, offering a powerful, all-in-one platform for metrics, traces, and logs. It provides a polished, unified user experience that many engineering teams value. However, this power comes at a significant cost, one that often arrives as a "bill shock" for teams as they scale.
The core issue isn't just the final cost, but the unpredictability of it. Teams find themselves spending more time managing observability costs than improving reliability. This article will break down why Datadog is so expensive, what to look for in a truly cost-effective alternative, and compare the top contenders.
We have discussed why datadog is so expensive and the main pricing caveats in detail in our blog on Datadog pricing.
What to Look for in a Cost-Effective Datadog Alternative
The right cost effective alternative to datadog is not the one with "cheapest" pricing. It must also address the core problems of unpredictable billing and vendor lock-in. We'll evaluate the top alternatives based on these four essential requirements.
Transparent, Usage-Based Pricing: The pricing model should be simple and predictable. You should pay for what you use (e.g., GBs of data ingested, metric samples) and not be penalized for scaling your hosts, adding users, or using open standards.
OpenTelemetry-Native: The platform should be built on OpenTelemetry. This is non-negotiable for avoiding vendor lock-in. You can instrument your applications once and have the freedom to send your data to any OTel-compatible backend.
Unified Platform: Datadog's main strength is its unified experience for metrics, traces, and logs. A good alternative should provide this same single-pane-of-glass experience without requiring you to stitch together multiple, disparate tools.
Flexible Deployment: You should have the choice between a fully-managed SaaS for convenience and a self-hosted option (on-premise or in your own cloud) for data privacy, compliance, and ultimate cost control.
Why SigNoz is the Best Cost-Effective Choice
At SigNoz, we believe that team of all sizes should have access to enterprise-grade observability, which is why it was designed from day one with OpenTelemetry as its foundation and flexible deployment options.
Let's evaluate SigNoz against the four essential requirements.
SigNoz Solves the Price Problem:
Datadog's pricing model includes multiple levers, like per-host fees, which are a poor fit for a modern microservices world. We have seen users running oversized "mega-VMs" just to optimize their Datadog bill. Your architecture should never be dictated by your observability tool's pricing.
SigNoz uses a simple, transparent, and usage-based model that scales with you. On SigNoz Cloud, logs and traces are priced $0.30/GB and metrics are $0.10 per million samples, with no per-host or per-user fees. This predictability has helped teams reduce their observability bills by up to 80% after migrating.
SigNoz Solves the Lock-in Problem:
Unlike platforms that add OTel support as a feature, SigNoz is OTel-native. This allows for a much deeper integration with OTel semantic conventions. If your team is committed to OpenTelemetry, SigNoz is the default choice, providing advanced features like Trace Funnels, external API monitoring, and out-of-the-box messaging queue visibility.
You are never locked into a proprietary vendor agent. You own your data and the way you collect it.
This also means SigNoz supports any technology, framework, or language that can be instrumented with OpenTelemetry. You can learn more about instrumenting your applications in the SigNoz documentation.
SigNoz Solves the Usability Problem:
Unlike other solutions, SigNoz uses a single columnar datastore for logs, metrics, and traces. This allows for seamless correlation between signals (e.g., jumping from a metric spike to the exact traces and logs causing it), providing a developer experience that is directly comparable to Datadog's.
SigNoz Solves the Deployment Problem:
Datadog is a cloud-only product, while SigNoz offers a fully-managed SigNoz Cloud, an Enterprise self-hosted option, and a free open-source Community version. This flexibility serves teams at all stages.
Understanding Datadog to SigNoz Cost Savings with an Example
Below is a clear, mid-scale example that uses each vendor’s native billing units. It is illustrative, not exhaustive.
1) Datadog usage we are evaluating
Logs
- Ingested: 7,110 GB / month
- Indexed: 7,110 million events / month
Traces
- Ingested: 21,400 GB / month
- Indexed: 10,700 million spans / month (kept equal to ingest using 2 KB per span to convert GB → events)
APM and infrastructure
- APM host-hours: 338,400 hours / month → ≈463.6 hosts (÷ 730 h)
- Infra host-hours: 438,450 hours / month → ≈600.6 hosts (÷ 730 h)
- Container hours: 1,103,000 hours / month
Custom metrics (Datadog)
- 15,000 indexed custom metrics / month
2) Assumptions used
- Average log event size ≈ 1 KB.
- Span size ≈ 2 KB for storage math.
- No commitments or extra discounts beyond list pricing.
- Host-hours → hosts conversion: We divide total host-hours by the hours in the billing month to get average concurrent hosts (default 730 h ≈ 365×24/12; use 24×days_in_month for exactness), then apply Datadog per-host/month rates.
- Datadog rates (annual billing): APM $31/host-mo, Infra Pro $15/host-mo; Log ingestion $0.10/GB; Indexed logs $1.70/M (15-day); APM ingestion $0.10/GB; Indexed spans $1.70/M (15-day); Container monitoring $0.002/container-hour.
- SigNoz rates: Logs $0.30/GB ingested, Traces $0.30/GB ingested, Metrics $0.10 per million samples.
3) What this costs in Datadog
| Line item | Cost |
|---|---|
| Ingested logs (7,110 GB × $0.10/GB) | $711.00 |
| Indexed logs (7,110 M × $1.70/M) | $12,087.00 |
| Ingested traces (21,400 GB × $0.10/GB) | $2,140.00 |
| Indexed spans (10,700 M × $1.70/M) | $18,190.00 |
| APM hosts (~463.6 × $31/host-mo) | $14,370.41 |
| Infra hosts (~600.6 × $15/host-mo) | $9,009.25 |
| Container hours (1,103,000 × $0.002/h) | $2,206.00 |
| Indexed custom metrics (15,000 @ $5/100) | $750.00 |
| Total Datadog | $59,463.66 / month |
4) The equivalent pricing in SigNoz
| Line item | SigNoz usage and rate | Cost |
|---|---|---|
| Logs ingestion | 7,110 GB × $0.30/GB | $2,133.00 |
| Trace ingestion | 21,400 GB × $0.30/GB | $6,420.00 |
| Metrics from infra hours | 21,045.60 M × $0.10/M | $2,104.56 |
| Metrics from container hours | 6,618.00 M × $0.10/M | $661.80 |
| Custom metrics | 0.01500 M × $0.10/M | $0.00 |
| Metrics from infra hosts | 110.54 M × $0.10/M | $11.05 |
| Total SigNoz | $11,330.41 / month |
5) What is the total savings?
- Total Datadog: $59,463.66 / month
- Total SigNoz: $11,330.41 / month
- Savings: $48,133.25 / month (~81% lower)
Notes
- Datadog list rates shown are annual billing with 15-day retention for indexed logs and indexed spans. Month-to-month and on-demand are higher. Always match your actual plan and retention. (source: Datadog)
- Results depend on the assumptions above. If you change log event size, span size, or the share of logs/spans you index, the numbers change proportionally.
- SigNoz eliminates per-host APM fees and separate log indexing fees, using simple per-GB and per-sample pricing.
This scenario shows how SigNoz directly eliminates the most punitive and unpredictable parts of Datadog's bill. You get the unified experience you like from Datadog, but with the open-source freedom and predictable pricing you need. Check out the SigNoz pricing page to estimate your monthly bill.
Getting Started with SigNoz
You can choose between various deployment options in SigNoz. The easiest way to get started with SigNoz is SigNoz cloud. We offer a 30-day free trial account with access to all features.
Those who have data privacy concerns and can't send their data outside their infrastructure can sign up for either enterprise self-hosted or BYOC offering.
Those who have the expertise to manage SigNoz themselves or just want to start with a free self-hosted option can use our community edition.
Application Performance Monitoring
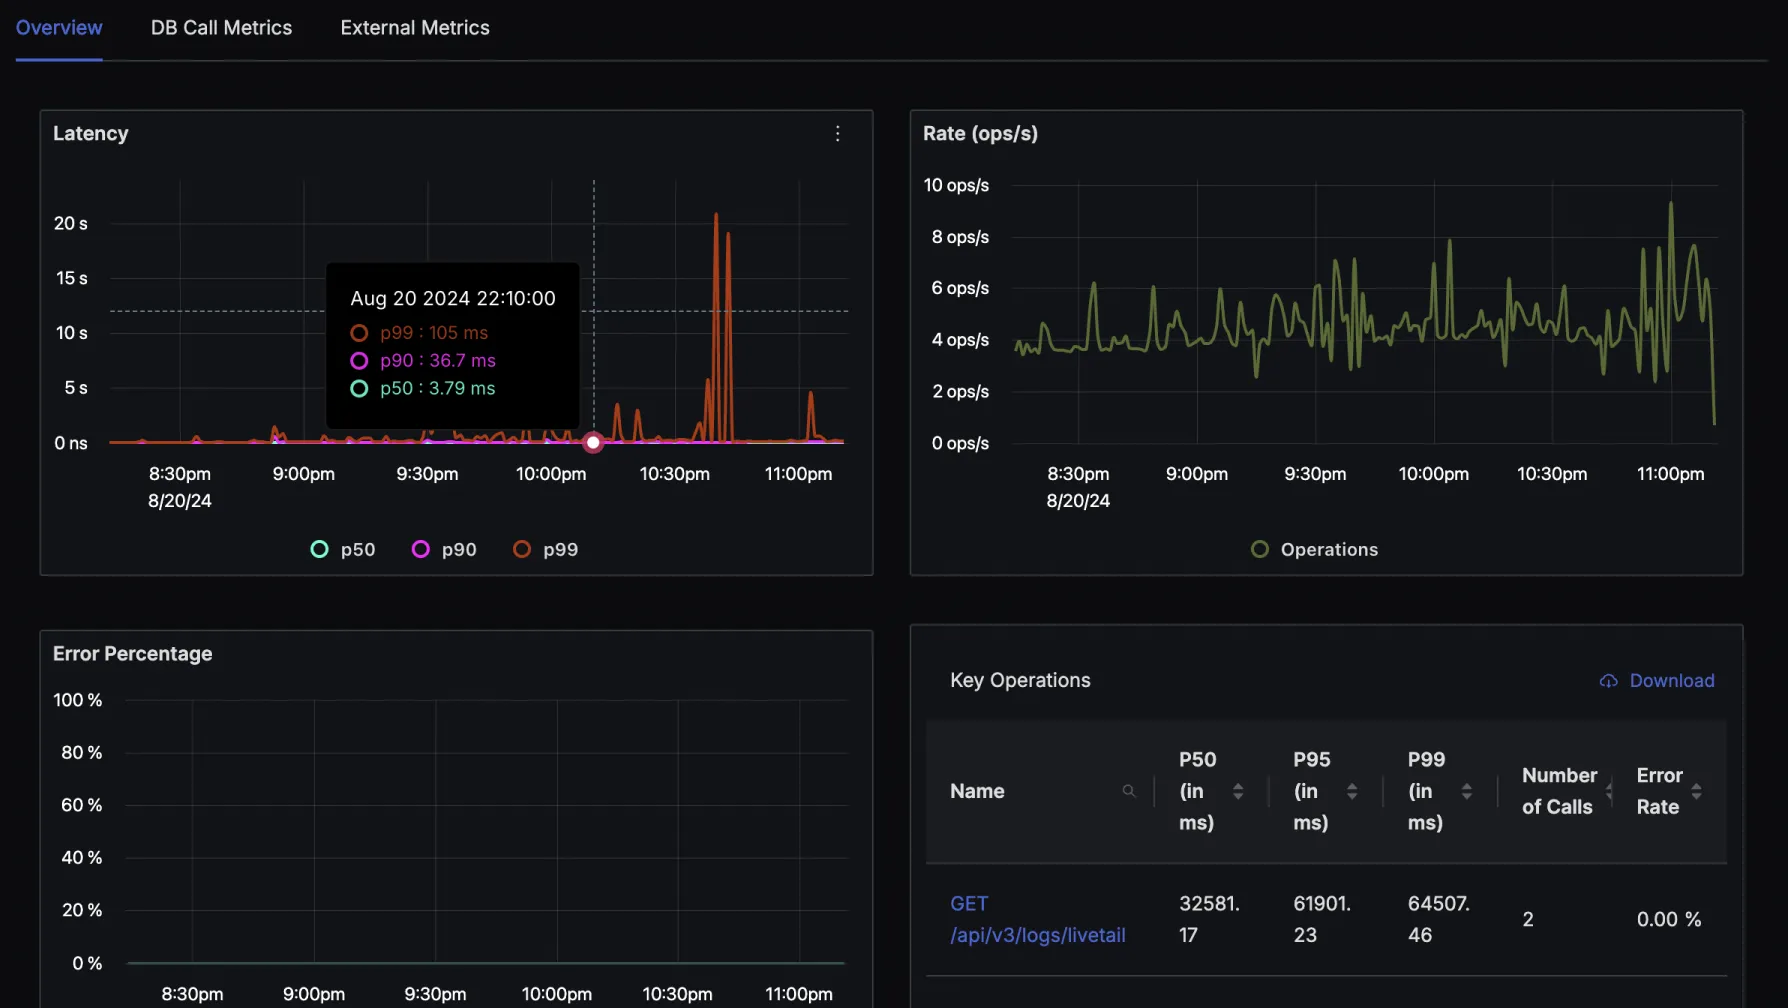
Out-of-the-box service charts for latency, throughput, error rates, ApDex, and top endpoints.
Distributed Tracing
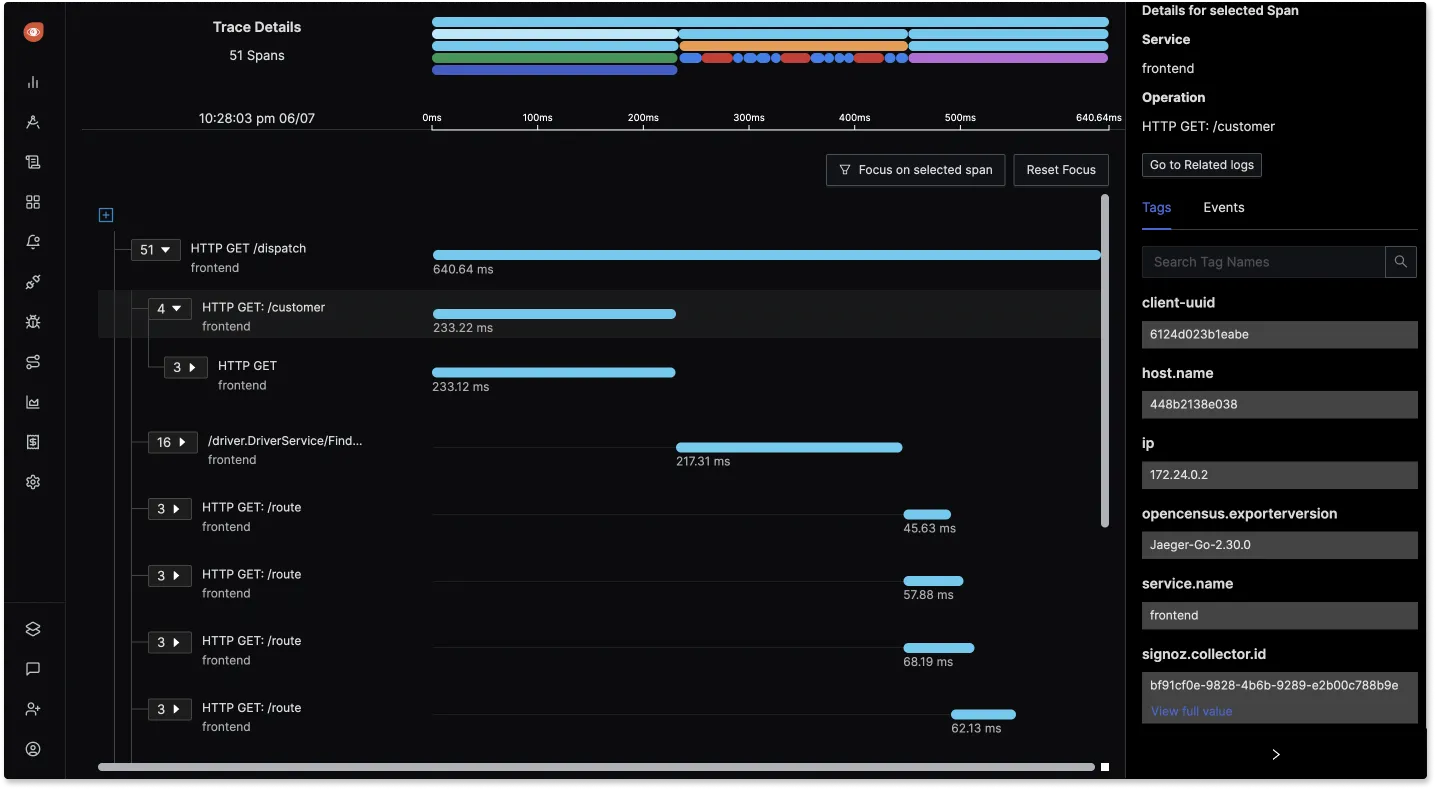
Follow requests across services with flamegraphs, span filters, and trace analytics.
Log Management
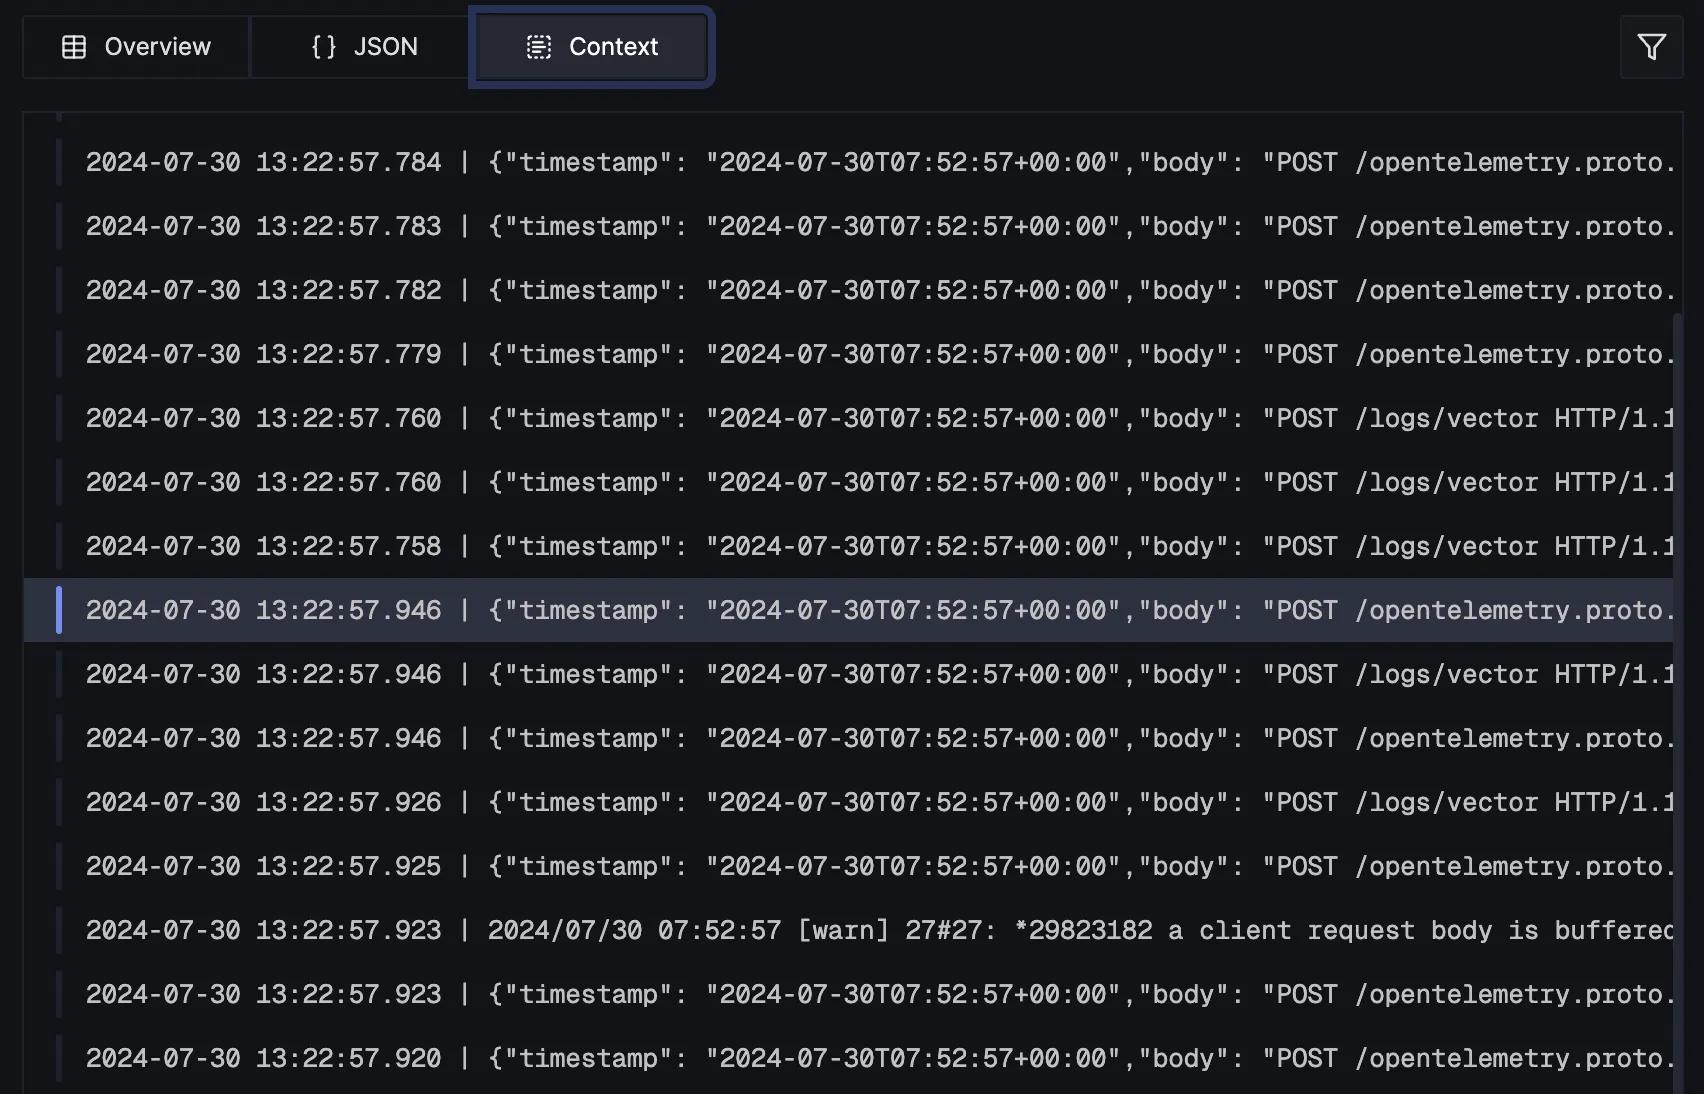
Centralize, query, and correlate logs with traces and metrics to debug faster.
Infrastructure Monitoring
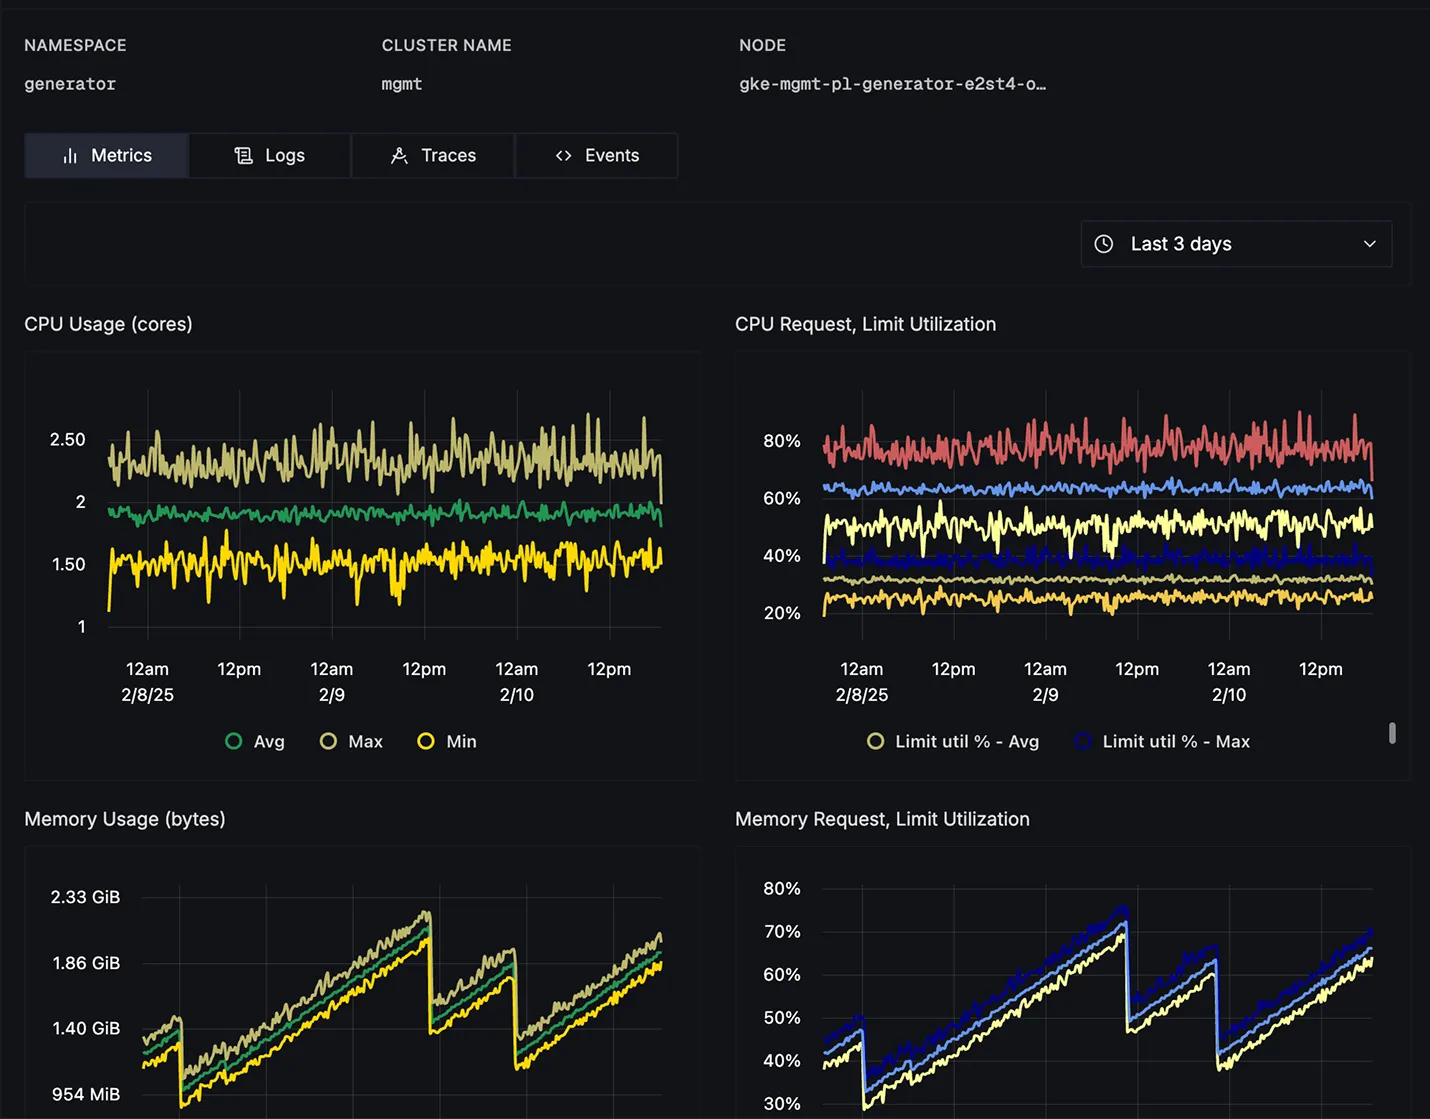
Track Kubernetes and host health with detailed CPU, memory, and network visibility.
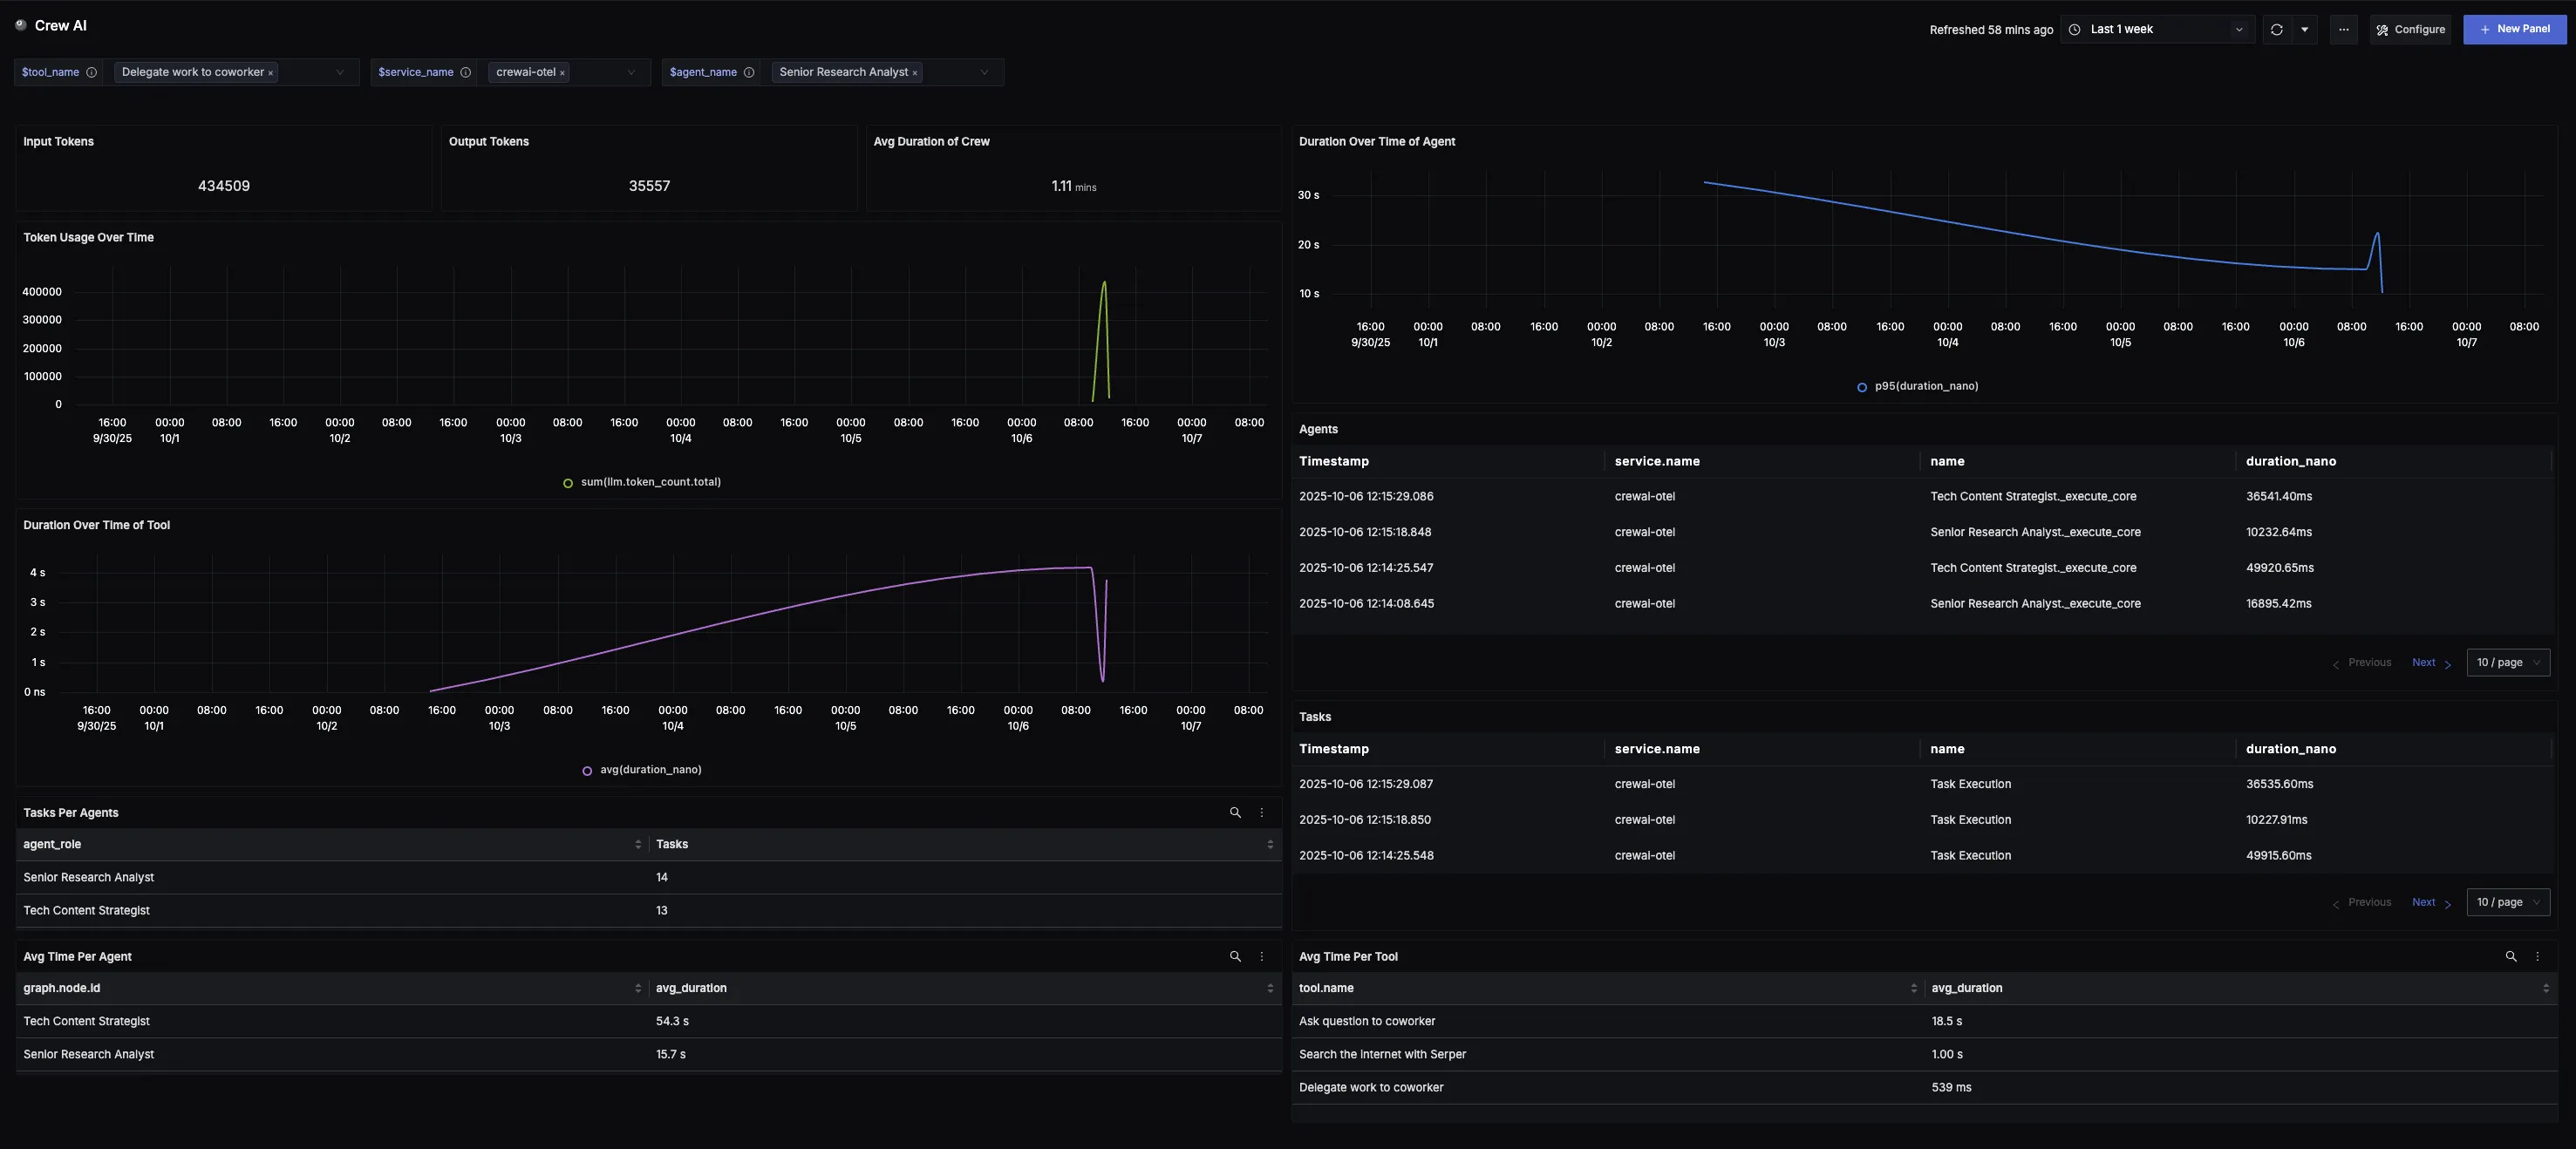
LLM Observability
Trace LLM applications with prompt-level visibility, cost tracking, and agent analytics.
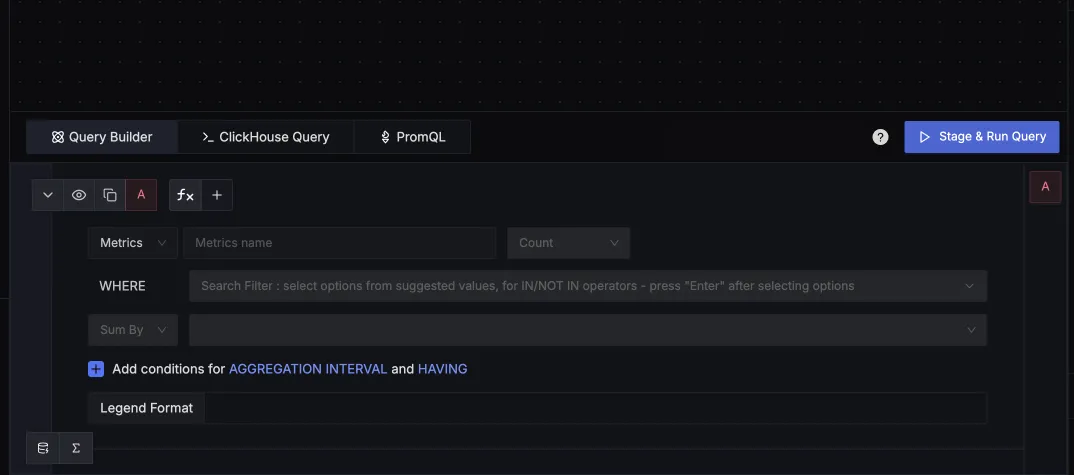
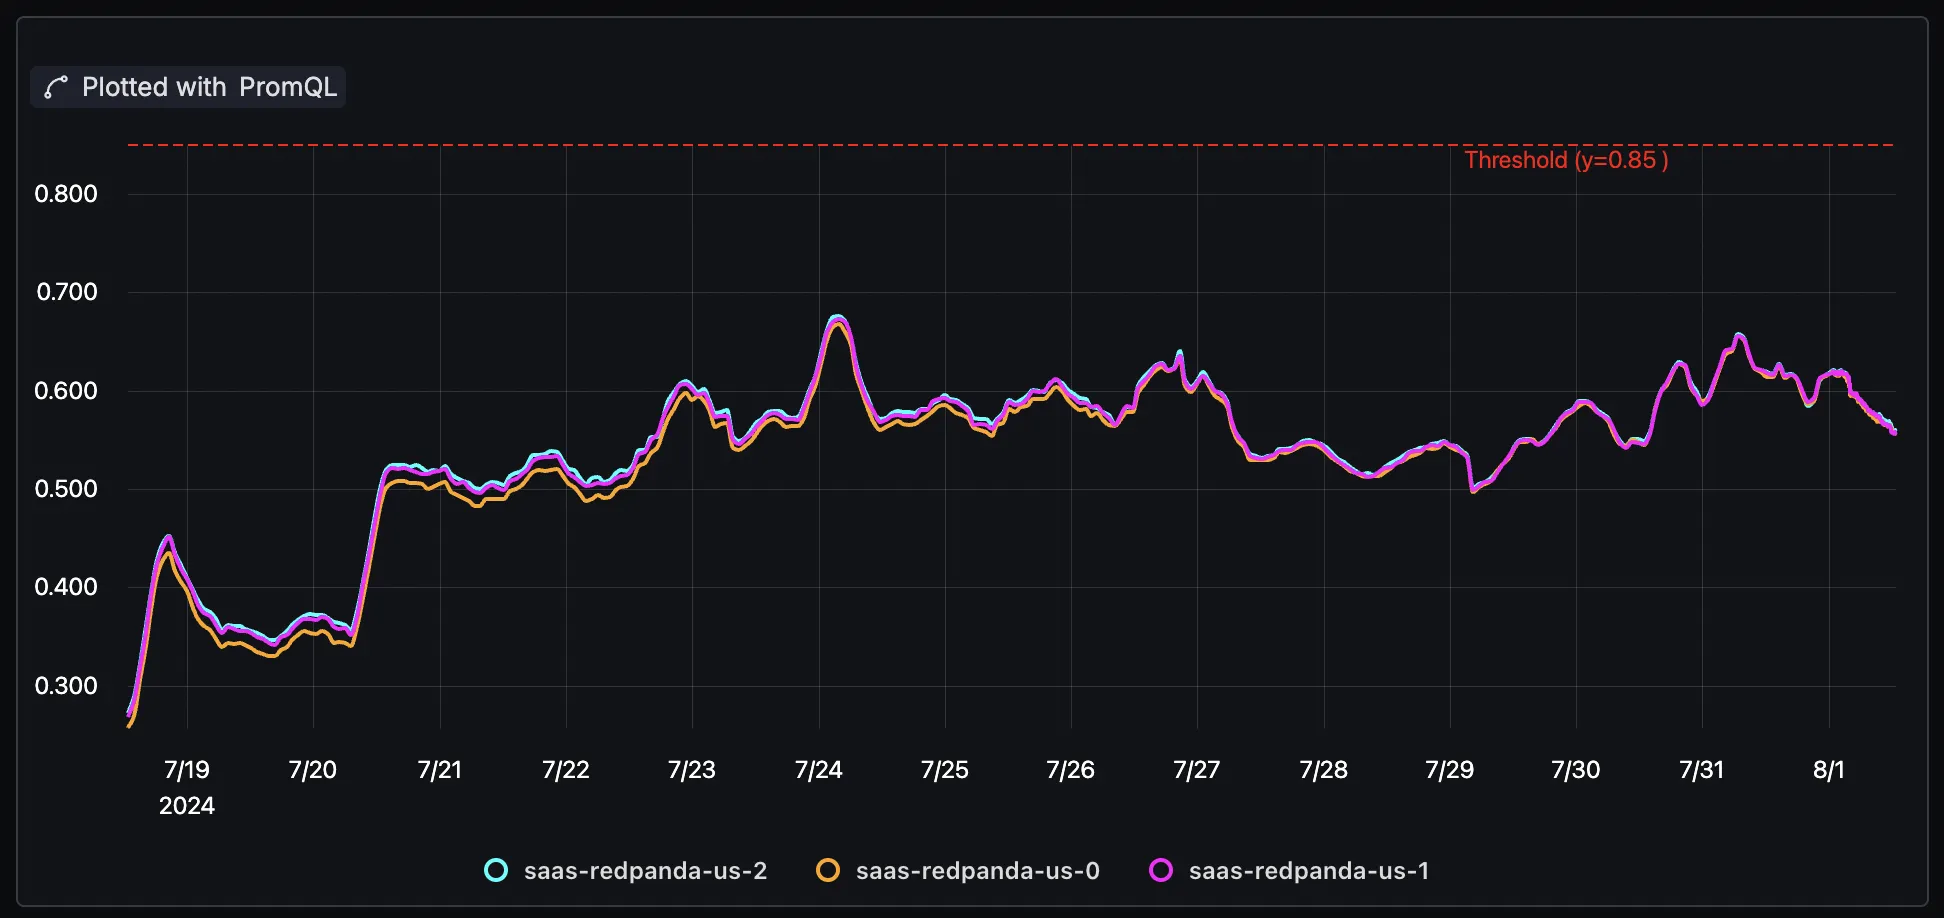
Metrics & Dashboards
Build PromQL-powered dashboards and visualize business and SRE metrics in one place.
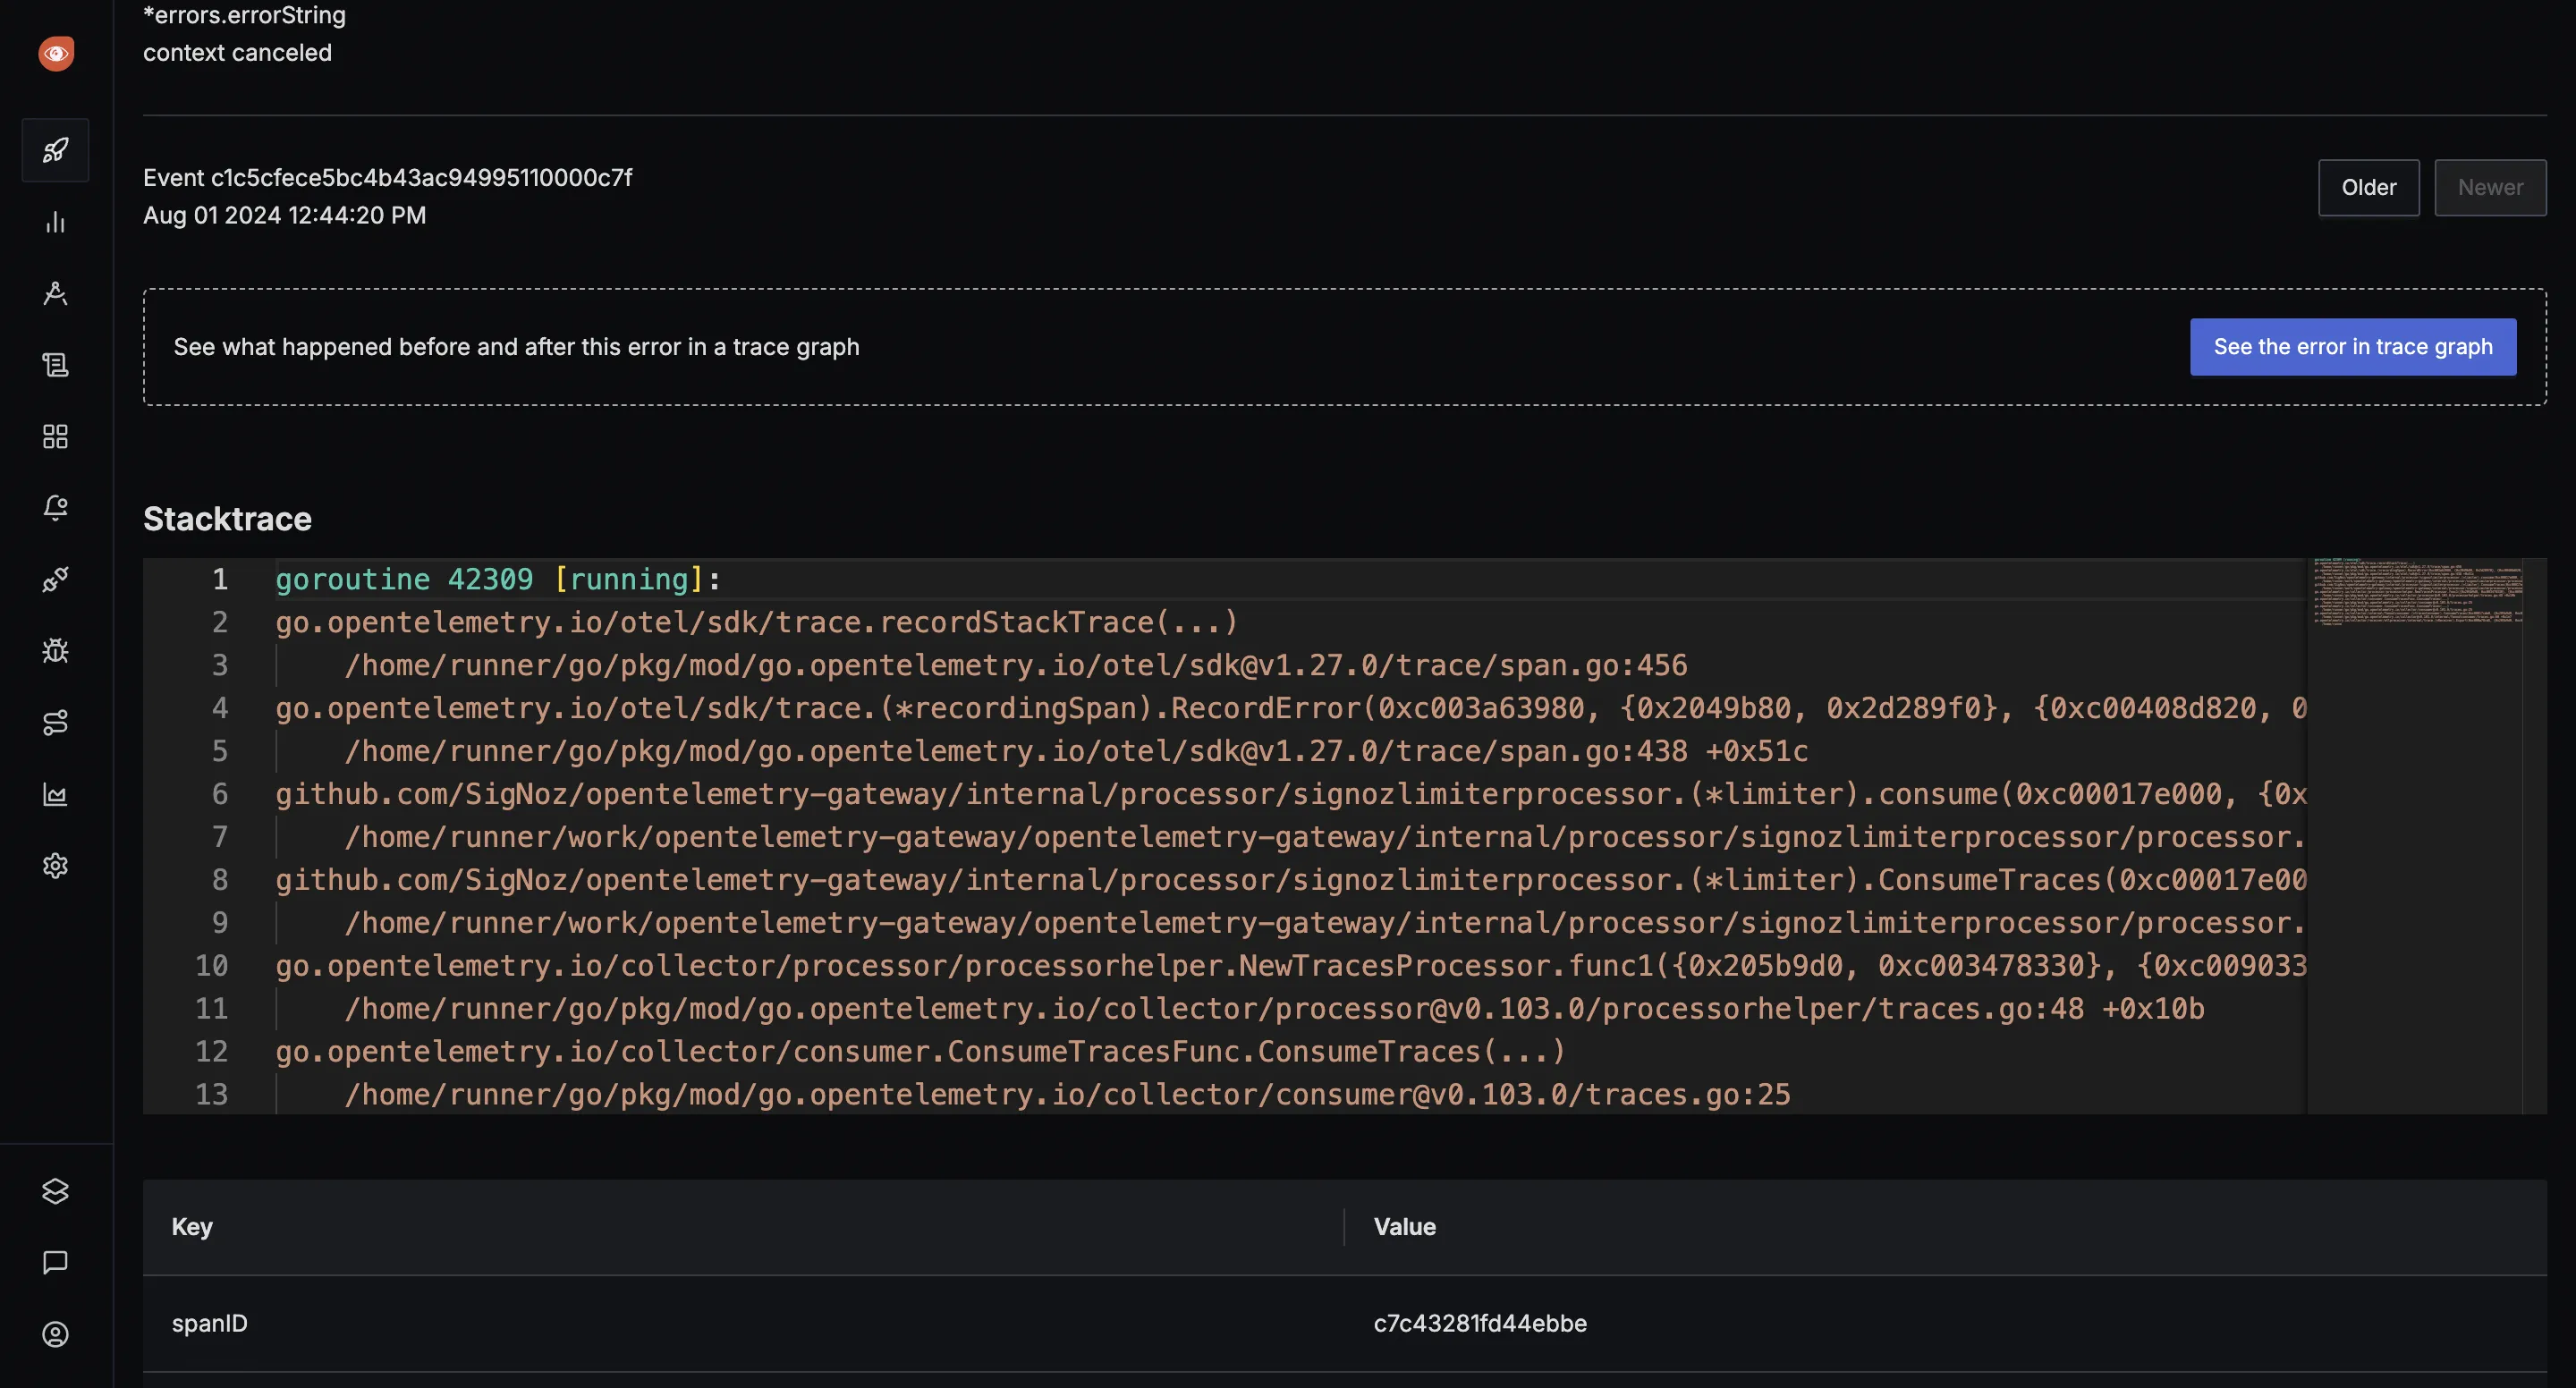
Exceptions Monitoring
Group and triage exceptions with stack traces, trends, and ownership context.
Alerts Management
Define alerts on metrics, logs, traces, and anomalies with multi-channel notifications.
External API Monitoring
Monitor third-party API latency, throughput, and error rates alongside internal services.
What about the other alternatives?
While SigNoz is the only option that checks all the boxes of a cost-effective Datadog alternative, other commercial platforms also compete with Datadog, though often with similar complexities.
1. Grafana Cloud (The "Stitched-Together" Stack)
Grafana is widely known as a great visualization tool. Its observability solution, Grafana Cloud, bundles Grafana with the "LGTM" stack: Loki (logs), Grafana (visualization), Tempo (traces), and Mimir/Prometheus (metrics).
Pricing:
Grafana Cloud also uses a usage-based model (per-GB, per-active-series), which is transparent and a huge step up from Datadog. It also has a generous free tier.
The Problem:
The "LGTM" stack is not one tool; it's four separate tools stitched together. This creates significant complexity, even in the cloud-managed version.
Fragmented Experience:
Each tool (Loki, Tempo, Mimir) has its own backend and its own query language (LogQL, TraceQL, PromQL). This creates a fragmented developer experience, and correlating data between signals is not as seamless as in a truly unified platform.
Self-Hosting Complexity:
While the components are open-source, self-hosting and managing this entire stack is a major engineering undertaking. This "free" option comes with high operational overhead.
Verdict: Grafana Cloud is cost-effective on paper, but you trade Datadog's bill complexity for operational and developer complexity. It lacks the single-pane-of-glass experience that makes Datadog appealing.
2. New Relic (The Other Legacy SaaS)
New Relic is another long-standing player in the APM space. It, too, has faced criticism for its pricing and has attempted to pivot.
Pricing:
New Relic shifted to a usage-based model, but it remains notoriously complex. Its pricing still includes a per-user fee (around $99 per user/month for full access), which directly contradicts the goal of making observability accessible to all engineers. It also features a black-box "CCU" (compute) pricing model, and data ingestion costs remain high, forcing heavy sampling.
OpenTelemetry-Native:
Like Datadog, New Relic relies on its own proprietary agent and has bolted on OpenTelemetry support as a compatibility layer. This does not solve the fundamental problem of vendor lock-in.
Unified Platform:
To its credit, New Relic does offer a unified platform where metrics, traces, and logs are presented together, which is a core strength similar to Datadog's.
Flexible Deployment:
New Relic is a SaaS-only solution. There is no open-source or self-hosted option, which is a major drawback for any organization with data privacy, compliance, or data sovereignty requirements.
Verdict: New Relic is not a truly cost-effective or transparent alternative. It largely replaces Datadog's complex billing with its own confusing and expensive model that still penalizes you for growing your team and offers no deployment flexibility.
3. Cloud-Native Tools (AWS CloudWatch, Google Cloud Operations, Azure Monitor)
Using your cloud provider's built-in tools seems like a simple, cost-effective choice. Let's evaluate how it fits into our evaluation framework.
Pricing:
These tools appear cheap because you avoid data egress fees. However, the costs for log and metric ingestion can add up surprisingly quickly, and their pricing models are often just as complex as Datadog's.
OpenTelemetry-Native:
This is the ultimate vendor lock-in. While these tools can ingest OTel data, they are designed to pull you deeper into their specific ecosystem. This is the exact opposite of OTel's vendor-neutral philosophy and makes any future multi-cloud or migration plans extremely difficult.
Unified Platform:
This is a significant weak point. These tools are often clunky, feel like separate services, and are less powerful than dedicated observability platforms. Their APM and tracing capabilities, in particular, tend to be weaker and less user-friendly.
Flexible Deployment:
By definition, these tools offer zero deployment flexibility. You are locked into a single cloud provider.
Verdict: A false economy. You trade one vendor lock-in for another and often end up with an inferior, yet still expensive, tool.
4. ELK Stack (Elasticsearch, Logstash, Kibana)
The ELK stack is a powerful, well-known solution, especially for log analytics.
Pricing:
The open-source version is "free," but this is a classic TCO (Total Cost of Ownership) trap. The real cost is in the engineering salaries and massive hardware resources required to run, scale, and manage a large-scale Elasticsearch cluster for logs, metrics, and traces.
OpenTelemetry-Native:
The ELK stack has its own agent (Elastic APM) and has bolted on OTel support. Furthermore, the stack is no longer truly open-source (it uses the non-OSI-approved Elastic License), creating vendor risk. The open-source fork, OpenSearch, is an option but adds another layer of fragmentation and management burden.
Unified Platform:
The ELK stack does provide a unified platform, with its primary strength being powerful log search and analytics.
Flexible Deployment:
The "free" appeal of ELK is its self-hosting flexibility. However, this is also its biggest cost, as the operational overhead is massive. A managed Elastic Cloud option exists, but it comes with its own resource-based pricing, similar to a cloud-native tool.
Verdict: A powerful tool for logs, but as a full-stack Datadog replacement, its TCO is extremely high due to operational complexity.
Conclusion - Choosing the Right Cost Effective Datadog Alternative
A good Datadog alternative helps you regain control over your observability budget and reduce costs, all while maintaining full visibility. While proprietary platforms like New Relic and Dynatrace offer powerful features, they often come with similar pricing complexity. Building your own stack with Grafana seems free but carries a high operational cost.
This is why an OpenTelemetry-native, unified platform like SigNoz stands out. It provides the "single pane of glass" experience teams love from Datadog but is built on open standards with a transparent pricing model. You get the full power of metrics, traces, and logs in one place, all while achieving 80% or more in cost savings.
Hope we answered all your questions regarding cost-effective Datadog alternatives. If you have more questions, feel to use the SigNoz AI chatbot, or join our slack community.
You can also subscribe to our newsletter for insights from observability nerds at SigNoz, get open source, OpenTelemetry, and devtool building stories straight to your inbox.
